Warm-season grass, autumn temperatures, and winter overseeding
The turfgrass growth potential (GP) is a number that represents the proximity of the actual temperature to the optimum temperatures for growth. GP is used for a lot of things. One can use it to make estimates of nutrient use, estimates of topdressing amounts, and to find the time in autumn when the cool-season growth potential starts to exceed the warm-season growth potential. Overseeding at about that time, or perhaps just a little bit before that time, seems like it would be ideal. Of course, the temperatures are a little different every year, but there must be an average time at which that transition takes place.
In fact, one of the first articles about GP (Improving overseeding programs: 1. the role of weather), by its creators at PACE Turf, Wendy Gelernter and Larry Stowell, was about this.
In a recent discussion, Jim Schmid mentioned that the change point in 2017 came later than he would have liked. I looked up some temperature data for Palm Springs, and I was especially interested in when the average change point is, and how the change point this year compares to that.
I downloaded temperature data from the NOAA’s climate data online site, and I’ve put the code and described what I did to make these calculations at GitHub. To keep things simple, and consistent, I omitted all the years in the final analysis in which there were any days with missing temperature data in the period from August 1 to November 30 in all the years from 1922 to 2017. This series of charts shows how temperature is related to that time (or inflection point) at which the cool-season GP starts to exceed the warm-season GP in autumn.
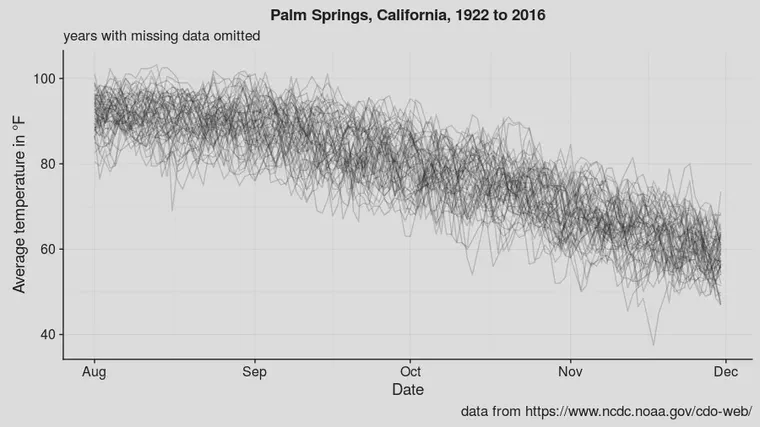
Here’s the temperature for 55 years (the years from 1922 to 2016 with no missing data) from August 1 to November 30. Each line is a year. That’s kind of a mess. But I’d like to take those temperature data and get some idea of when an optimum date to overseed might be.
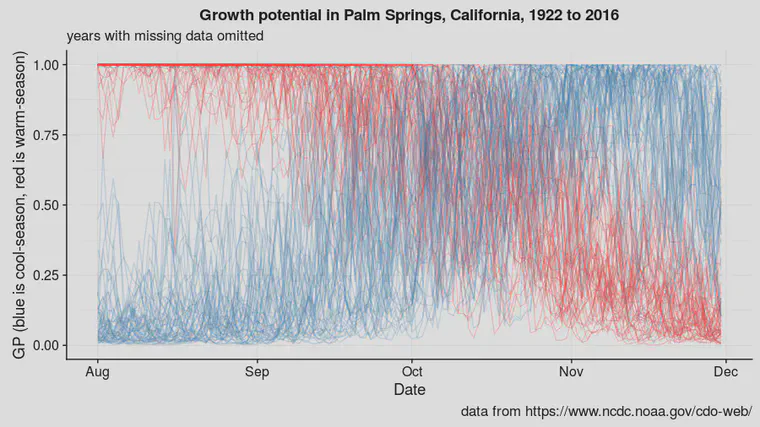
I can convert the temperatures to GP. Now this is pretty! The 55 red lines are the temperatures converted to GP for warm-season grass, and the 55 blue lines are the cool-season grass GP. That’s a jumble, but I notice that the lines are generally crossing in October. But I can’t make much else out of it.
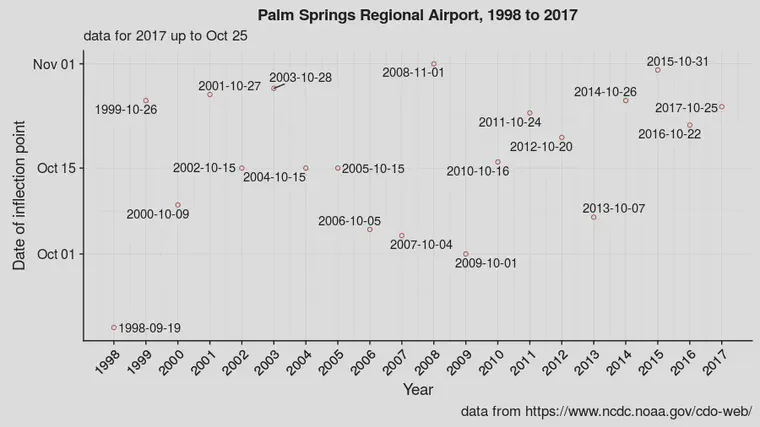
Larry Stowell taught me a few years ago that rather than looking at where the red lines and the blue lines cross, one can calculate the cumulative sum of the difference between the cool-season and warm-season GP, and there will be an inflection point (a change in direction) when this change occurs. For example, here are those cumulative sums for 1998 to 2017. The 2017 inflection point hadn’t happened as of October 25.
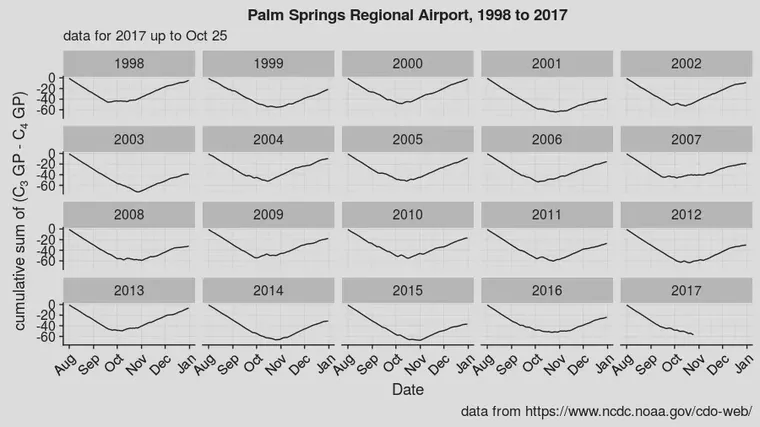
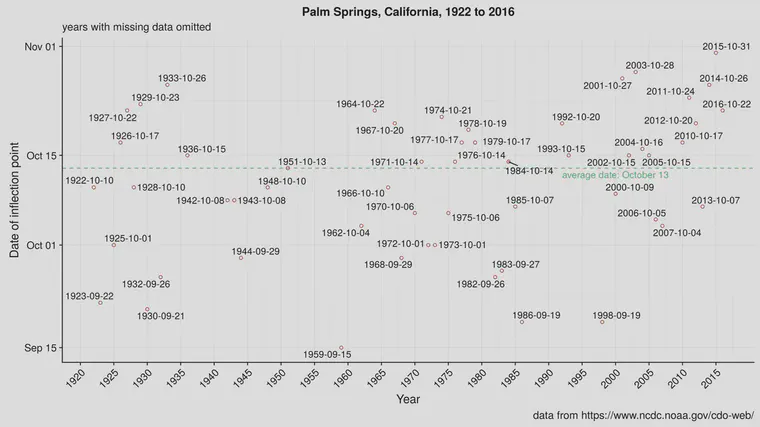
Now that certainly cleans it up nicely. I looked up recent data from the airport and filled in the missing data to make that chart, and I also identified the dates of the inflection point in each year and plotted them on a timeline from left to right.
For the longer time series, the 55 years since 1922 without missing data, I did the same thing. And the average (median) date when the cool-season grass GP starts to exceed the warm-season grass GP in Palm Springs has been October 13.