The probability of a dollar spot epidemic
The Smith-Kerns Dollar Spot Prediction Model uses air temperature and relative humidity to give a probability that dollar spot disease will occur on turfgrass. Here’s how it works.
I’ve written about reactive greenkeeping being at least a viable option, and have implied that it is preferable to proactive greenkeeping. With a little effort, one can get information (data) about the weather, the amount of water in the soil, the quantity of nutrients in the soil and the quantity of nutrients used by the grass, the growth rate of the grass, and so on. Even if one doesn’t have an exact number, one can estimate these and other pieces of useful information.
An exciting addition to the turfgrass manager’s toolkit in this regard is the Smith-Kerns Dollar Spot Prediction Model. For cool-season grasses, I’ve always recommended a proactive approach to dollar spot prevention. Specifically, I’ve looked at the long-term average of air temperatures, identified those months at a location during which the average temperature is above the optimum—that is, when the grass is expected to suffer from heat stress—and have suggested that preventative fungicides be applied during those months.
But the weather isn’t the same as the average conditions. It would be inefficient to be proactive in these preventative applications when the weather is not conducive to dollar spot, and it would be ineffective to rely on this proactive approach based on averages when the weather conditions stray from the averages, as is sure to happen.
Here’s a brief description of the model from the University of Wisconsin:
“The Smith-Kerns Dollar Spot Prediction Model is a logistic-based model that uses a 5-day moving average of daily relative humidity and daily average air temperature to create a probability that dollar spot will occur on a given day. The model was created by Dr. Damon Smith and Dr. Jim Kerns and has been validated through years of additional field research conducted primarily in Wisconsin but also in Oklahoma, Pennsylvania, Mississippi, Tennessee, Connecticut, and New Jersey. The model can be used by golf course superintendents to more accurately time control measures to suppress dollar spot.”
This is a link to the full article: “Development and validation of a weather-based warning system to advise fungicide applications to control dollar spot on turfgrass.” Use of this “weather-based warning system” is a great way to be reactive to the actual conditions. If one wants to think of that as being proactive, I can go along with that too!
I recently made some calculations of dollar spot probability using the Smith-Kerns model. The model takes as inputs the 5 day average of air temperature, and the 5 day average of relative humidity, and based on those inputs it produces a probability that a dollar spot outbreak will occur. In the validation trials for this model, application of fungicide when the probability was 20% or higher provided effective control of dollar spot. Note that this 20% level is only a starting point, and one can evaluate the model and dollar spot pressure at one’s site, with the grass varieties and management practices that one uses, to find an appropriate site-specifc threshold.
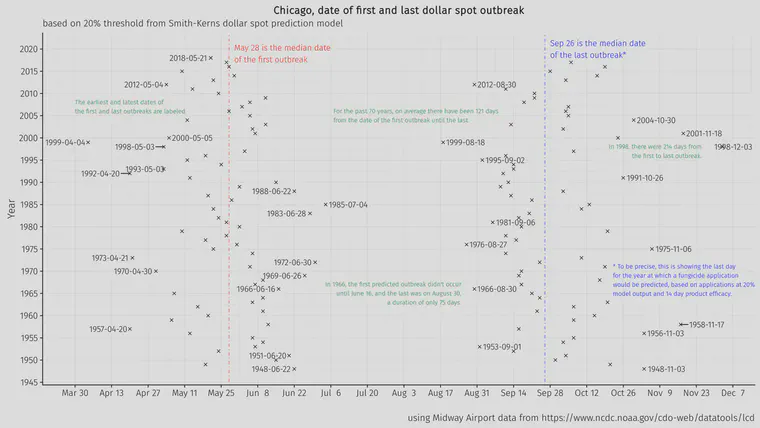
One of the things I looked at was historical data for Chicago. In the past 70 years, 1966 had the lowest probability of dollar spot.
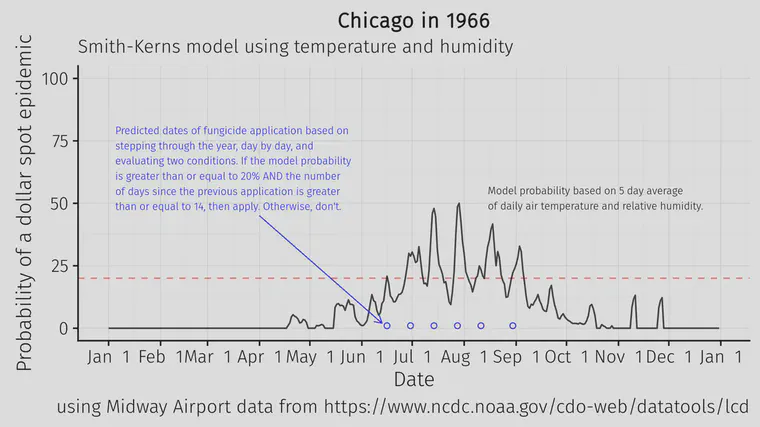
I also looked at when the model probability exceeded 20% in the spring. On average in Chicago, that happens on May 28.
The calculations are easy once one has put the equations into a file, or written a script to make the calculations, or has put the data into files available at the Wisconsin TDL page. Getting historical data, however, can be complicated.
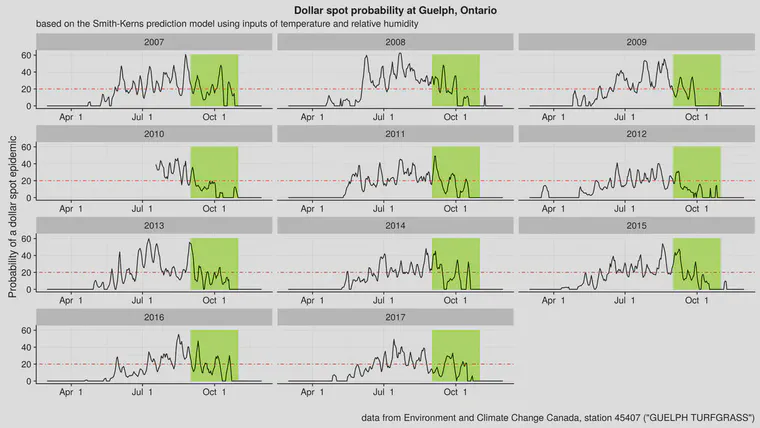
I was running that script to get hourly data from Guelph, Ontario. After downloading eleven years of data—that’s a lot of hours—I then ran the temperature and humidity through the model to generate a dollar spot probability. I wanted to look especially at September and October to see what type of disease probability tends to occur.
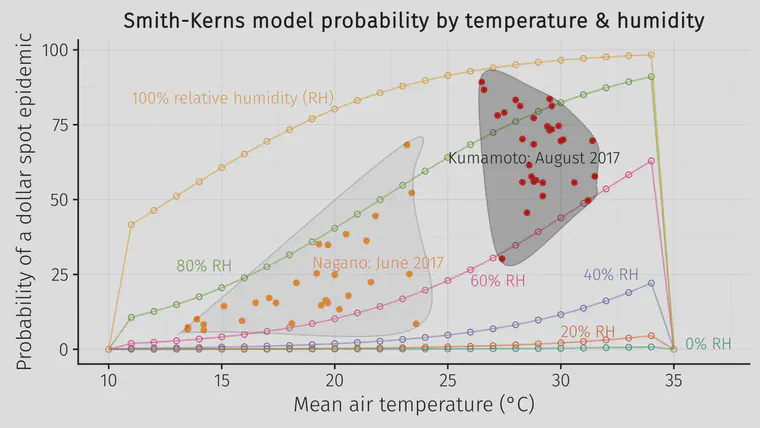
Relative humidity has a big impact on the model probability. When the humidity is 100%, even at low temperatures, the probability of a dollar spot epidemic is nearly 50%. However, when the humidity is 20% or below, even when air temperature is extremely high, the probability of dollar spot is less than 10%.
More information about the model, and some spreadsheets to get started, are available from the University of Wisconsin Turfgrass Diagnostic Lab.