Thailand putting green performance in July: a summary
Measurements of green speed and surface hardness from 19 golf courses
While Eric Reasor was collecting the data on ball roll dispersion in Thailand – read yesterday’s post for more about that – I collected data on the the same greens. The data summary shown here are the data I collected from 19 greens on 19 different courses. The grasses on these greens included various bermudagrass varieties, seashore paspalum, and manilagrass.
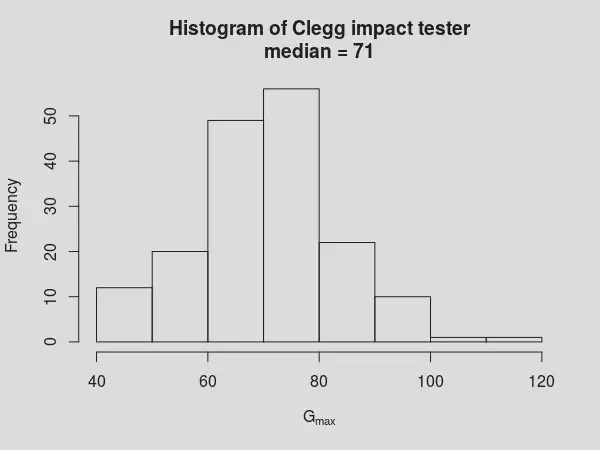
I took 3 stimpmeter readings per green, measured 9 locations per green with a 500 g Clegg soil impact tester, and used a TDR-300 with 7.5 cm rods to measure soil water content at those same 9 locations. I also made some measurements of soil temperature, surface temperature, and air temperature.
I showed the distribution of air temperature (median was 31.8°C) and heat index (median was 38.9°C) in a previous post.
Here’s the summary of soil and surface temperature from these greens.
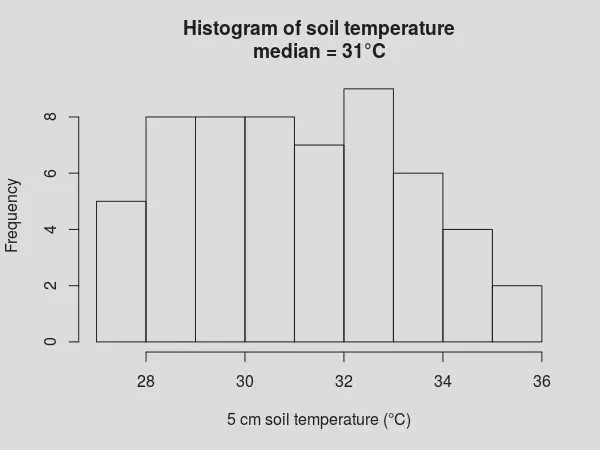
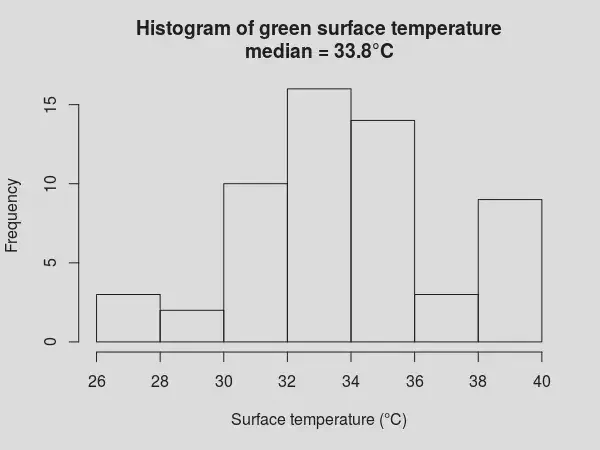
Putting greens in Thailand tend to be relatively soft, and the measurements in July were consistent with previous measurements.
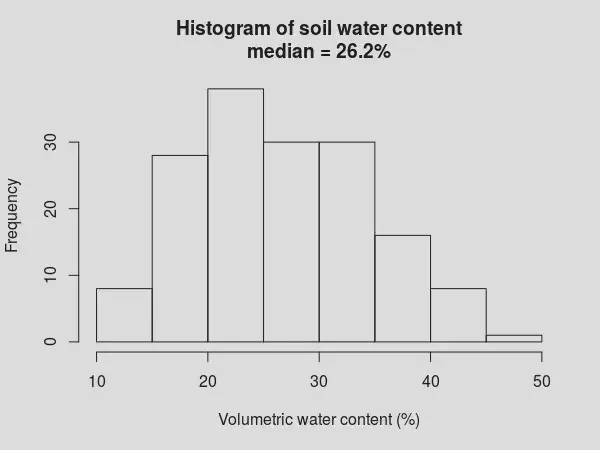
This is the distribution of soil water content.
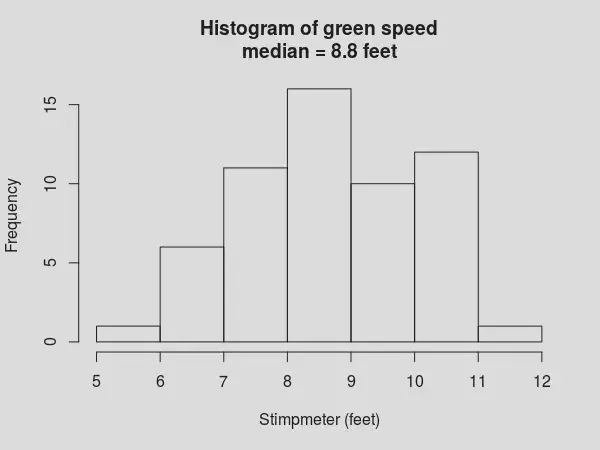
This is the distribution of green speed.
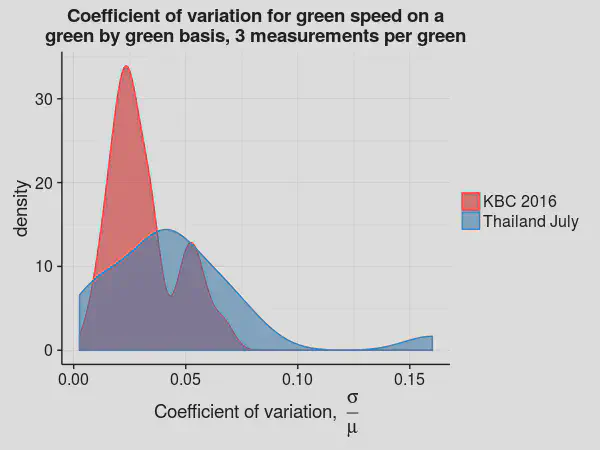
I measured the speed on each green in 3 different locations. With that, I get some idea not only of the green speed, but also about the variation in green speed. I express the variation in green speed within a green as the coefficient of variation (cv), which is the standard deviation of the measurements on a green divided by the mean of the measurements on a green.
Then I compared the distribution of cv for the 19 greens measured in Thailand with the cv for 26 greens measured during the recent KBC Augusta tournament in Japan. Under tournament conditions, there was slightly less variation in green speed. But many of the greens in Thailand had variation the same as measured during a tournament.
For more summaries of putting green measurements, and of measurements from greens in Thailand, see this post on playing with numbers. There are links to handouts and other data sources there. Or look at the charts in these slides: