Historical clipping data
I like to look at a 5 day (or similar duration) moving average
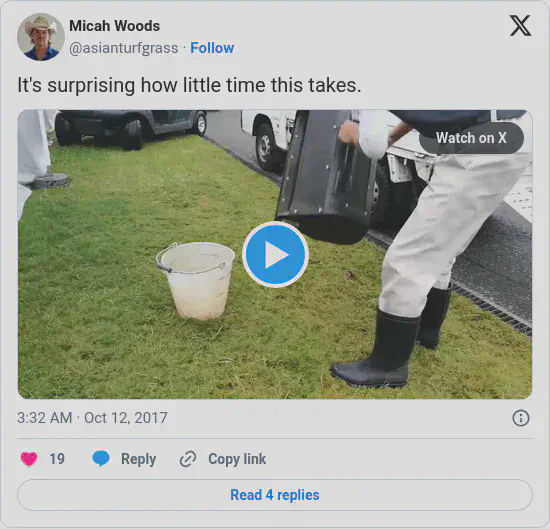
It is really interesting, for me at least, to see how much grass grows. One way to put a number to how much grass grows is to measure the clipping volume of the grass mown from an area. With putting greens, for example, the baskets are going to be emptied anyway, so why not record how many clippings are in the baskets? It doesn’t take much time.
After one has the measurement, it may look something like this. These are the clipping volumes for 19 greens (18 holes plus the practice green) on a golf course in Japan that was mown 189 out of 273 days from January 1 through September 30 this year.
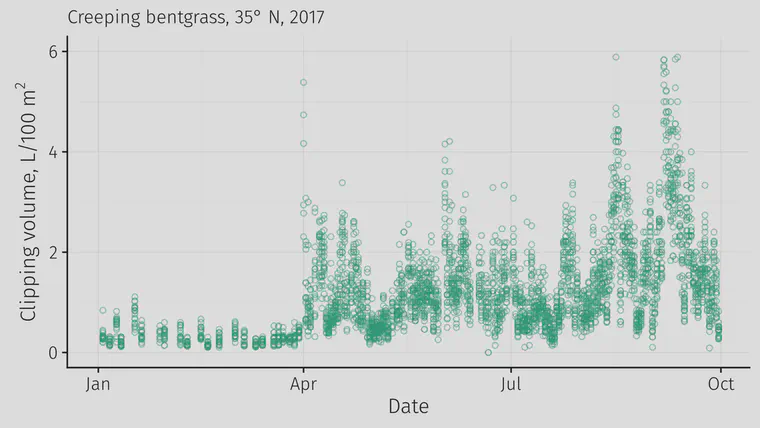
Actually, that’s a bit messy. One isn’t going to be able to make many decisions from that set of data. And I only want to collect data if I can use it as a decision-making tool. Of course, having the measurements from multiple greens allows one to check the variability in clipping volume from green to green, as I’ve described in morning clipping volume during tournament week and shown in this chart.

But what I’m most interested in is how much the grass is growing. To do that, I like to look at a moving average. This next chart takes the 189 days of mowing data this year and plots the daily average (from all 19 greens) and has a line showing the 5 day moving average (4 previous days, plus today, averaged).
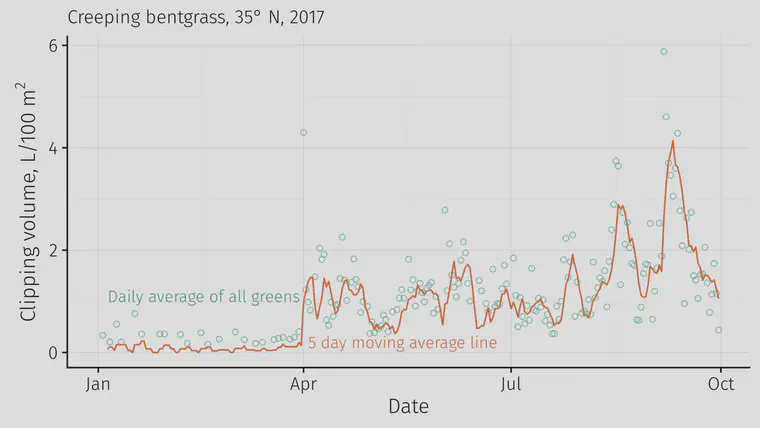
The moving average seems easy to use as a decision making tool. What is the level of growth we have right now, as represented by the moving average, and is it moving in the direction I want it to be for tomorrow, next week, and next month? If it is, then I’ll keep doing what I’ve been doing. If it isn’t, then I’ll make adjustments.