Two suggestions about clipping volume data recording
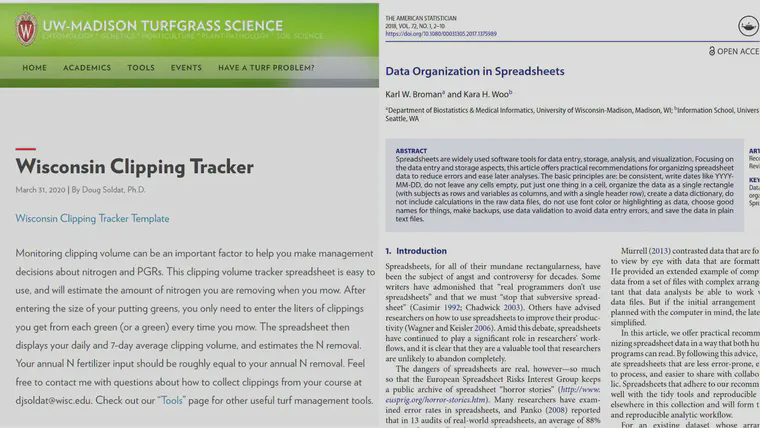
I’ve recommended these before, and having found myself repeatedly suggesting the Wisconsin clipping tracker template (read about this at the UW site1) and the Data organization in spreadsheets article. This post is a bookmark for that topic.
After having looked at a lot of different clipping volume recording layouts, I think it makes the most sense to put dates in the first column, and different areas measured as columns, and notes about the measurement on a particular date added in columns on the right side of the data.
Then each row is a single day, with a column containing the date, multiple columns containing clipvol data for however many measurements were made, and additional columns at the right which can show the daily average, or standard deviation, or notes about what rolling or mowing or other practices were done.
That’s how the clipping tracker template put together by Doug Soldat is laid out. And that may be all you need. But if you want to read a really interesting article about data organization and storage in spreadsheets, then you’ll enjoy Karl Broman and Kara Woo’s guide from a few years ago.
If you really like spreadsheets, you’ll probably have already seen these stories. From the past few months, here are a couple stories of spreadsheets in the news.
Read more about this topic at the UW site: https://turf.wisc.edu/2020/03/wisconsin-clipping-tracker/. I’ve hosted a duplicate copy of the template file on the ATC site. ↩︎