This is a soil pH chart that I do like
You’ve see the photos from Doug Soldat with the striking effect of potassium on snow mold, haven’t you? He joined me on the ATC Doublecut to talk about that. At the end of the show, I brought up soil pH charts, and we discussed the common one that I don’t like, and don’t use, starting at about the 46:20 time in this video. You can also listen to this episode as a podcast, here.
We were talking specifically about the article Soil pH - nutrient relationships: the diagram by Hartemink and Barrow. That article reviews “the diagram,” that chart that you’ve certainly seen some version of. It’s the one showing essential mineral nutrients as bars across a gradient of pH, with the thickness of the bar at any pH meant to indicate the availability of that element at that soil pH. I don’t like that diagram because I think there are so many exceptions to it that it is misleading. Hartemink and Barrow wrote this:
The soil pH cannot be used to predict or estimate plant nutrient availability, and the diagram should not be used as it suffers from numerous exceptions and barely represents any rules.
What I do is describe soil pH in words, rather than with a chart. I like to keep the soil pH at 5.5 or above to minimize soluble aluminum (which can be toxic to roots) and to ensure soil microbial activity is not limited by a low soil pH. And I like to make sure the soil pH is at 8.5 or below—anything higher than 8.5 and there is something, likely sodium related, causing that high pH, and that pH should be brought down.
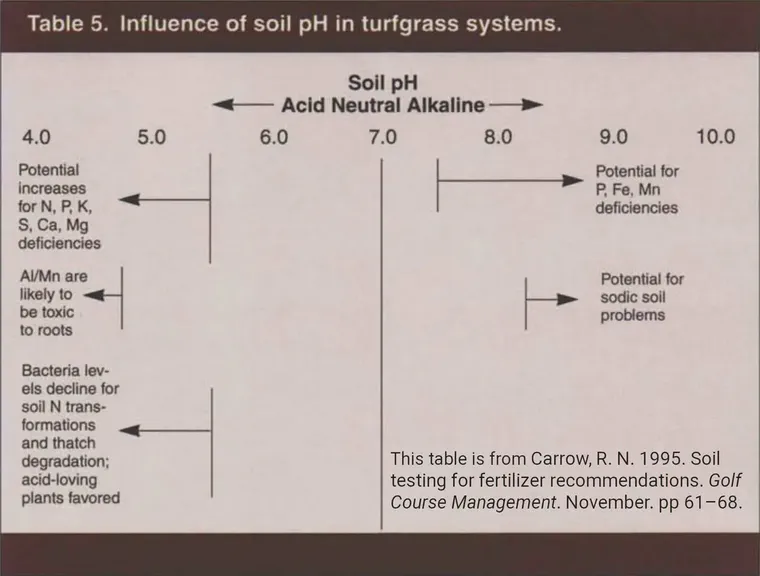
While I had pH diagrams on my mind, I was pleasantly surprised to come across this one by Dr. Carrow.1 This is one I like. It’s got all the reasons why I like to use pH 5.5 and 8.5 as cutoff points for a normal acceptable range, and the few extra bits about potential nutrient deficiencies are nicely phrased.
The chart is in Dr. Carrow’s article Soil testing for fertilizer recommendations. ↩︎