An extremely useful tool for the study of putting green speed variability
No, I’m not talking about the stimpmeter.1 And this tool will probably only be useful for a few people. In fact, the tool is probably not what you think it is. But this story may be of general interest.
I’m quite interested in putting green speed. I’ve written numerous articles about green speed and variability in the measurements for ゴルフ場セミナー. In English, you can read this report about some of the measurements I’ve made.
What I find more and more interesting is the variability in putting green speed. Not so much from course to course, or day to day, but more so from green to green on the same day, or from location to location on the same green.
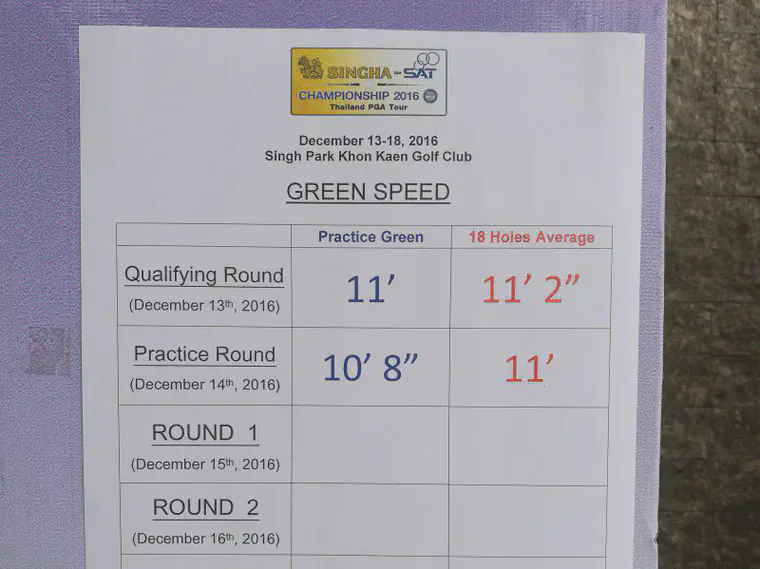
When the average of 18 different greens is 11 feet, what is the range of measurements on individual greens? Is it from 9 feet to 13 feet? Or is it from 10 feet 8 inches to 11 feet 4 inches?
As usual when studying this topic, I found myself studying Thomas Nikolai’s A Superintendent’s Guide to Putting Green Speed.
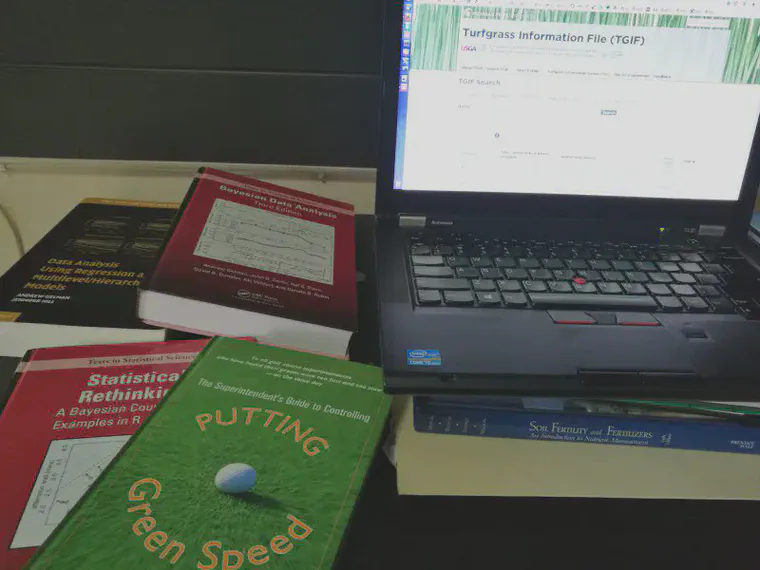
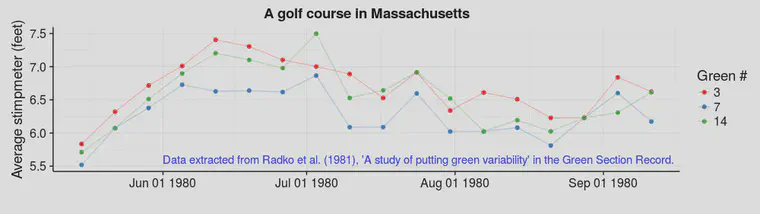
That led me to Radko et al. on A study of putting green variability.
So here is where the extremely useful tool comes in. I wanted to get the data from the article, to make some calculations of my own. So I turned to the WebPlotDigitizer. This has been an extremely useful tool for me on many occasions.
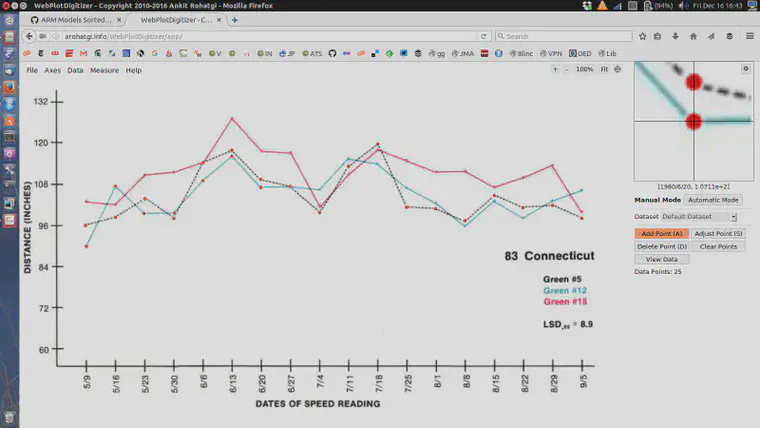
With those data from the chart now in a file I can work with, I’ve been able to make a number of calculations.
And how about those green speeds in 1980?
Although in general, the stimpmeter is what I use for assessing variability in green speed. ↩︎