Comparing nutrient content of turfgrass soils
The MLSN guidelines were developed from a large dataset of soil tests collected from good-performing turf. You’re probably familiar with the MLSN guideline as a minimum level, with fertilizer recommended to make sure the soil doesn’t drop below the guideline. In addition to the MLSN guideline, one can also look at any soil nutrient level and compare it to the distribution of that element in the MLSN dataset. That’s the SI.
We explained the SI in the GCM article Just what the grass requires as:
The sustainability index is the proportion of the modeled distribution that reports values lower than the sample soil test value. This is a metric that assists turf managers in the evaluation of soil nutrient levels over time. It also provides a guide for the development of nutrient management programs. Perhaps most important, the sustainability index identifies and rewards the restriction of nutrient inputs when they are not necessary to meet turf performance goals.
We also wrote about the SI in our preprint on Minimum soil nutrient guidelines for turfgrass developed from Mehlich 3 soil test results. You can find the equations to calculate SI in that paper, and an explanation that the SI will be a number in the range from 0 to 1.
How does this work? Let’s look at K. Here’s a histogram of more than 3,000 soil tests for K from the MLSN data. Each bar is a bin, showing the count or frequency of samples having that amount of K.
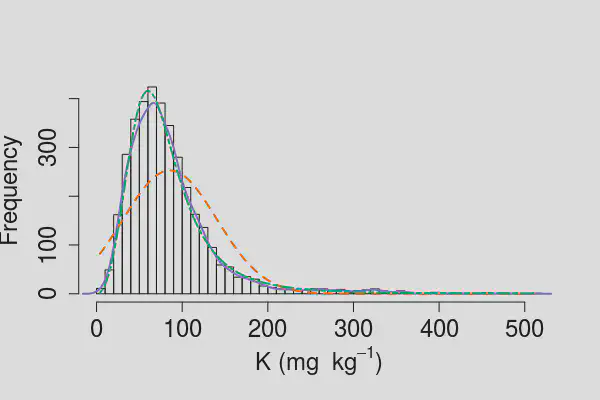
In this histogram, each bin has a width of 10 mg kg-1 (ppm). There are very few samples with K less than 10 ppm. It looks like about 50 samples from 10 to 20 ppm. More than 150 in the range from 20 to 30 ppm. Almost 300 in the range from 30 to 40 ppm. The largest bin is in the 50 to 60 ppm range, where there are more than 400 samples. Sometimes the K is much higher, at around 200 ppm or 300 ppm, but you can see that is uncommon—the bins at that level of soil K don’t contain many samples.
This is the distribution of K. The overlying lines are representations of the the distribution. The purple line is the density of the samples, and the dashed green line is a log-logistic distribution that we fit to match the data as closely as possible. The dashed orange line is a normal distribution that we fit to match the data as closely as possible, but the shape of the normal distribution curve doesn’t match the data very well.
If we consider all the samples together, there is some proportion less than 1 ppm, some proportion less than 50 ppm, and some proportion less than 100 ppm. To find this, we use the cumulative distribution function, to find the cumulative amount up to a certain point. A plot of those same K data from the histogram, as an empirical cumulative distribution function (ECDF), looks like this. The red line is the actual data. The grey line is the log-logistic distribution that we fit to the data.
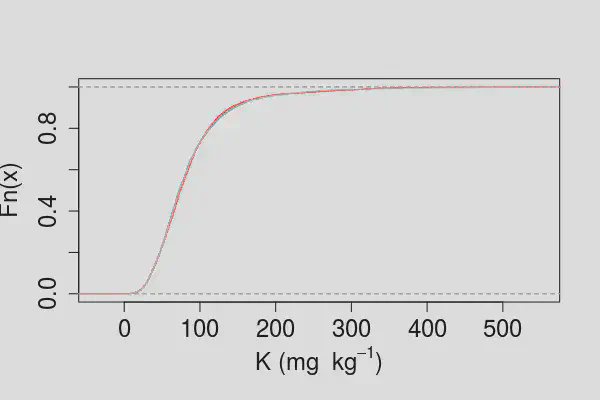
From the histogram, the bin with the highest number of samples is about 60 ppm. The median of all the samples seems to be at about 60 ppm. We can see on the ECDF that when the soil K is about 60 ppm, the y-axis is at about 0.5. This chart is showing the fraction of samples in the data that are below the corresponding value on the x-axis. If the K is at 0, there are no samples below that. If the K is at 100, the proportion of samples below that is about 0.7. When the soil K is 400, almost all the samples are below that.
With the cumulative distribution function (cdf), the result is expressed in terms of “what proportion of samples are less than this value.”
From these distributions of soil nutrients, we made a sustainability index calculator. As an example, here’s a screenshot of the SI using conventional nutrient guidelines.
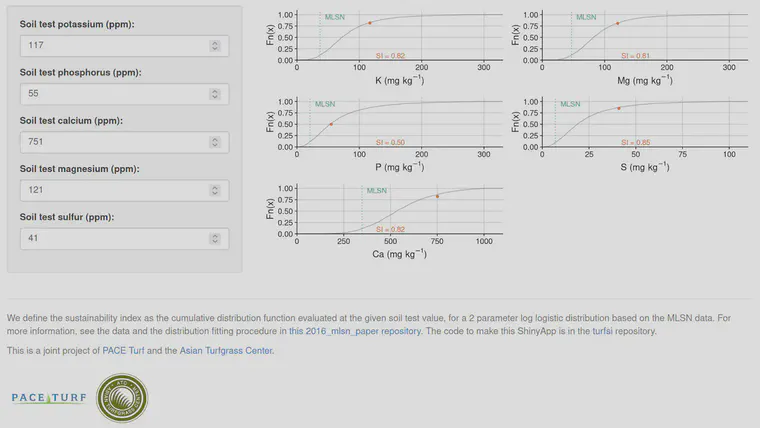
The SI is a number from 0 to 1. If the SI is 0.5, about half the samples in the MLSN data are below that level, and half are above it. If you have an SI of .18, then 18% of the samples are lower, and 82% are higher. As you can see above, the SI of the conventional guidelines is in the range of 0.81 to 0.85 for S and Ca and Mg and K, and is 0.5 for P. That means the conventional guidelines are set at a level that is higher than the actual soil conditions on about 80% of turf sites for most elements, and right about the 50% level for P.
Let’s see the SI for the median values of the Global Soil Survey 2015 report. Remember, the Global Soil Survey is samples collected from explicitly good-performing turf.
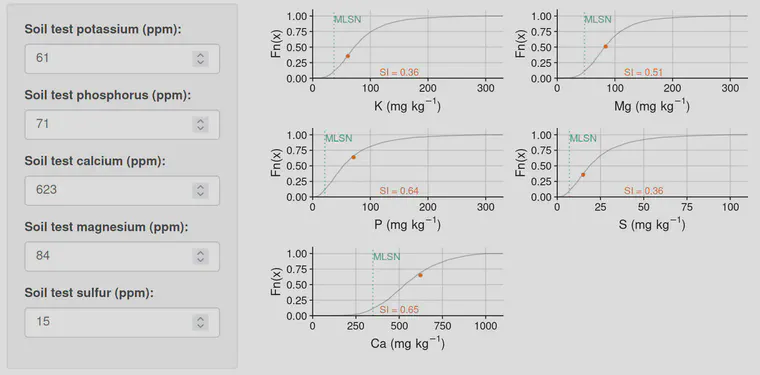
The SI of the Global Soil Survey median values ranges from .65 for Ca to .36 for K and S. These are right in the middle of the distribution.
If you are interested in how your soil test results compare, you can find the calculator here.