First month of summer dew point depression
Dew point depression is a convenient way to look at how humid the conditions are. This has some practical application to turfgrass growing conditions and just how much heat and disease pressure the grass is facing. To get the dew point depression, you subtract the dew point from the air temperature. When that difference is a small number, it means the air temperature is close to the dew point. When the air temperature is far above the dew point, those conditions are relatively dry.
I looked at some locations around the world during the first month of the most recent meteorological summer;1 that’s December 2025 for the southern hemisphere locations and June 2026 for the northern hemisphere locations.
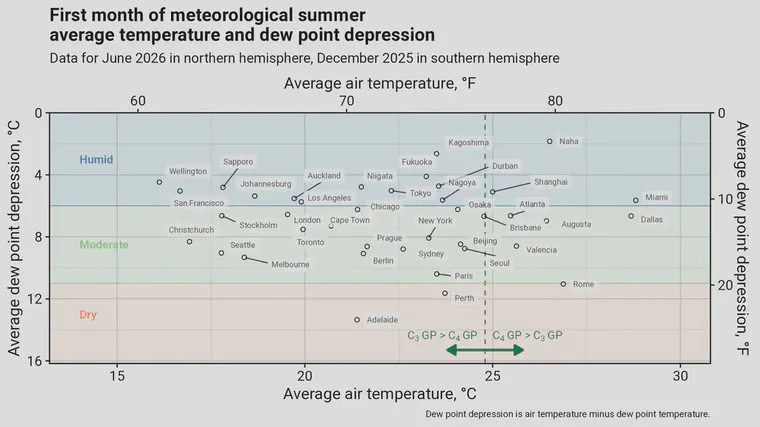
I’ve used a dew point depression of 6 °C as a limit between humid and moderate conditions. I used 11 °C as a dividing line between moderate humidity and dry air.
I also marked the point at which the PACE Turf warm-season grass turfgrass growth potential (the C4 GP) exceeds the cool-season (C3) GP. The reality is that over a long time period2 (years), C4 grasses are more competitive than C3 from about 20 °C. But over seasonal time periods, the difference between C3 and C4 GP is a good indicator of temperature stress.
Plotting the temperature and the dew point depression together is one way to visualize the types of stress turf faces at a particular location, and to find other location that experience similar conditions. London and Toronto and Auckland? I wouldn’t have expected to see those locations so similar in the first month of summer.
The meteorological summer is June, July, and August in the northern hemisphere; meteorological summer is December, January, and February in the southern hemisphere. ↩︎
If you are interested in this, please make sure you are familiar with my analysis of Places with high growth potential (GP) all year long. ↩︎