Growth potential as a proxy for season length
I often express the temperature-based growth potential (GP) as a number between 0 and 1. That is, I don’t multiply GP by 100 to express it as a percentage.
One advantage of keeping the GP on the scale of 0 to 1 is easy multiplication. I often multiply the GP by another factor, and when the GP is from 0 to 1 there is no need to adjust back from a percentage by dividing by 100.
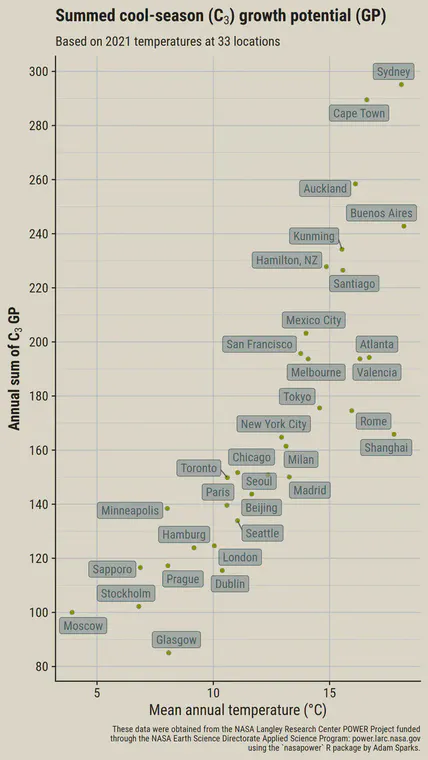
Another thing I often do with GP data is sum it. This can be done weekly, or monthly, or in the case of the chart below, annually.
When the GP is expressed as a number that has a minimum of 0 and a maximum of 1, this can also be thought of as a day. If the GP is 0, that day is no good for growing grass. If the GP is 1, the temperatures that day were close to optimum for that grass.
By summing the GP, I use it in this way as a proxy for the duration of the growing season. More specifically, I use it to compare locations in terms of the relative number of good days for growing grass, when looking only at temperature.
One thing I do with the sums is look at sand topdressing equivalents. I’ve calculated that in 2021, Minneapolis had a season of 138 days and New York City had a season of 165 days. If 8 mm of sand produced perfect conditions in New York City, then the equivalent amount of sand in Minneapolis would be $\frac{138}{165}(8) = 6.7$ mm.
This is an easy way to compare things like nitrogen rate, topdressing amounts, and mowing events.