Can we guess how low the P is here
Ben Pease shared a remarkable photo, and you won’t believe how low the P is
When I see a photo like the P deficiency one shared by Ben Pease (see photo below), I am really curious to know the soil test levels of the element.
Based on the research by Kreuser et al., I expected that the soil test P would be less than 10 ppm by the Mehlich 3 extractant in order to show the type of response that Ben saw.
Ben did get the soil tests done. Thanks to Ben Pease for the photo and PACE Turf for this version with annotations.
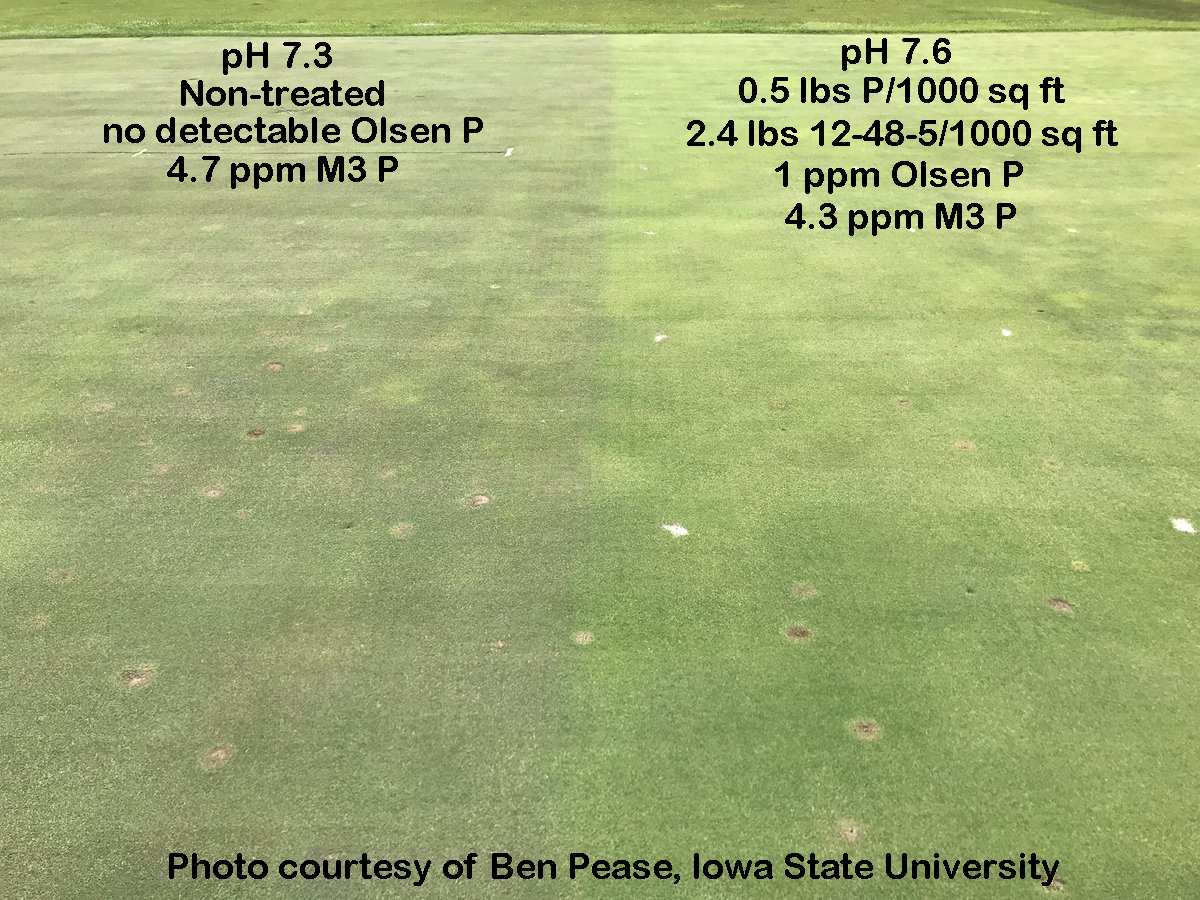
Where no P was added at left, the average Mehlich 3 P in the soil was 4.7 ppm. At right, where a small amount of P was added, the average was 4.3 ppm.
Now for something about how this relates to the MLSN guidelines. When the MLSN guidelines were introduced in 2012, they seemed really low. I used to recommend 35 ppm P, and with the first version of MLSN we dropped it all the way to 18 ppm. With the MLSN update in 2014, it went to 21 ppm.
Compared to conventional guidelines, MLSN seems low. But compared to the levels where one sees a deficiency, or where one can get a response to the element by applying it as fertilizer, MLSN seems generous.