The turfgrass genki level, part 3: turf growth response measured by clippings
In part 2, I showed how the ratio of N applied to standard N gives an indication of how much one is pushing the grass to grow. I call that the genki level (GL).
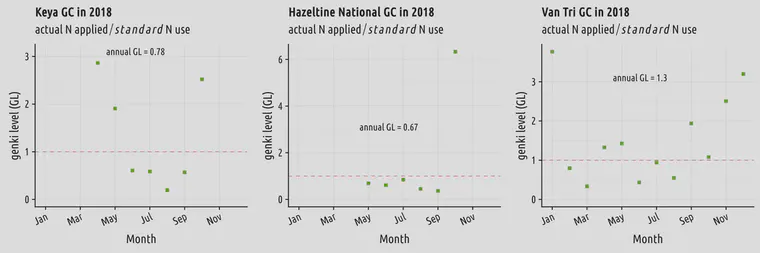
How much the grass really does grow can be measured by the clipping volume. With the GL as above in 2018, and the temperatures and GP as shown in part 1, this was the clipping volume at these locations in 2018.
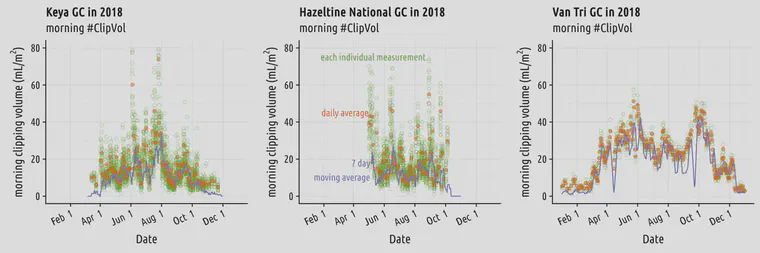
By looking at the GL and at the clipping volume, one can see how much one was pushing the grass to grow at any time, and then can see how the grass responded.
Jason Haines has suggested another way of looking at this. He calls this the turfgrass speedo (we now call it the GvX for growth vs. expected growth) and it is the actual clipping volume divided by the maximum clipping volume that one would ever want to see, with that maximum multiplied by the growth potential.
I took the clipping volume data from these three locations in 2018 and calculated a turfgrass GvX for each month in which the greens were mown. For Keya I used a monthly maximum of 600 mL/m2, for Hazeltine I used 500, and at Van Tri I used 2,000.
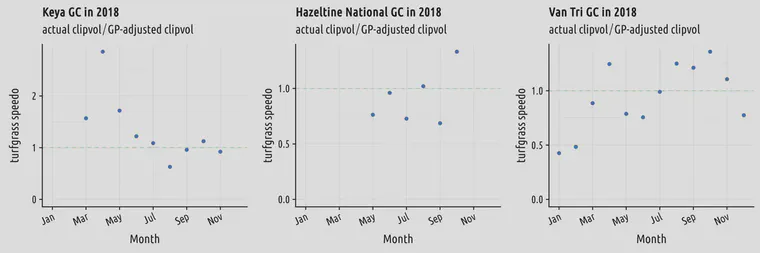
The GvX is of course quite sensitive to the value that one has set as the maximum for that location. That’s why we recommend NOT adjusting the maximum, and instead using a standard value of 20. When I wrote this post originally back in 2019, I made some initial calculations, as above, with a maximum clipvol that I allowed to vary. But I would not do that today.