Two soil organic matter timelines
I’ve tried to explain the value of total organic material testing by comparing it to the soil organic matter. In the timelines shown below, the total organic material in the top 2 cm (0.8 inches) of the rootzone is five or six times greater than the soil organic matter in the top 10 cm (4 inches) of the rootzone.
For details about why these tests give such different results, see my posts titled A Tale of Two Tests and Organic matter separation from turfgrass soil samples, to start.
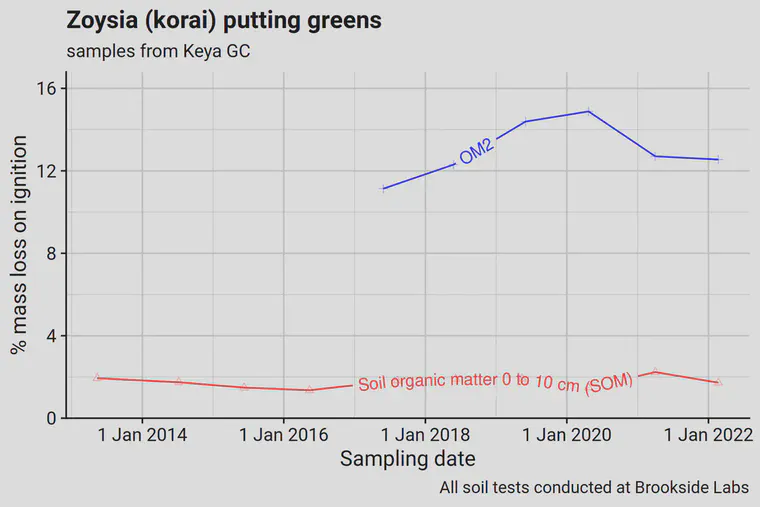
We can see in the Keya samples that for the past 11 years, the soil organic matter (SOM) has hovered right around 2% (20 g/kg). But check out that OM2! It went from about 11% in 2017 to almost 15% in spring of 2020, then with an extra hollow-tine cultivation event in 2020 combined with a substantial amount of sand added, the OM2 dropped down to less than 13% in spring of 2021.
After doing this OM2 testing year after year, I’ve noticed that the total organic material data—especially the OM2—vary a lot more than does the SOM. One can use the OM2 data to determine when one may need to add more sand topdressing.
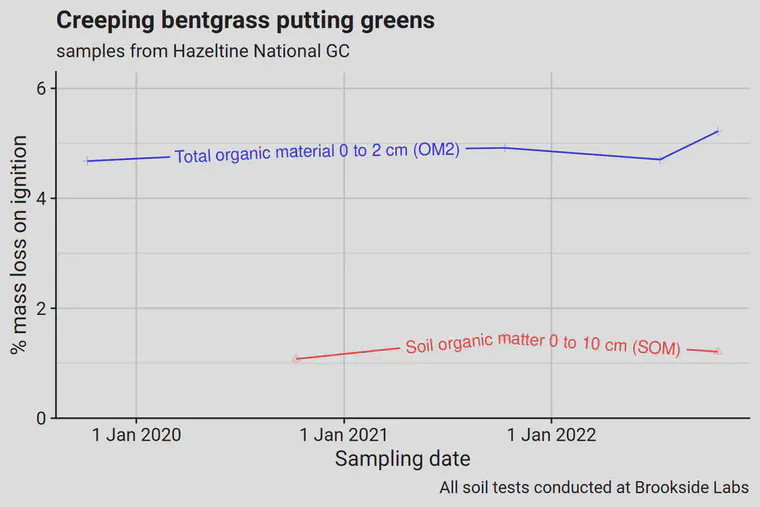
The Hazeltine data don’t vary so much, but that tells us something too. As expected, the SOM does not vary much. This line is 3 years of SOM data, from autumn 2020 through autumn 2022. The SOM is around 1 to 1.5%. The OM2 is over four years, and that’s gradually increased,1 a little bit each autumn, from just below 5% in 2019 and up to 5.2% in autumn of 2022.
The SOM data are not useful here in deciding if the sand topdressing is keeping up with the accumulation of organic material near the soil surface. Of course, the soil organic matter testing should not capture any of that accumulation, because the SOM test excludes living and dead undecomposed plant material. The OM246 testing method is designed to measure both the SOM and the living and dead undecomposed plant material.
So when we see the OM2 creeping up a little bit year after year, that result can be interpreted as the accumulation of a little bit more of total organic material, and it’s easy to see that something is changing, even though the change in this case is subtle. With the SOM, we can’t see this change so clearly.
You may see a dip between autumn 2021 and autumn 2022 samples. That was a late July sampling, and it stands out here for being a little lower. I can speculate about why it may be lower, such as possibly less plant material with fewer carbohydrate reserves in mid-summer compared to autumn. I suggest trying to sample, whether for nutrients or for total organic material, at approximately the same date each year. By sampling at the same date, the variability in test results caused by seasonal effects is minimized. ↩︎