Waterfall chart of putting green calcium levels
A waterfall chart can be used to represent nutrient availability and use in turfgrass.
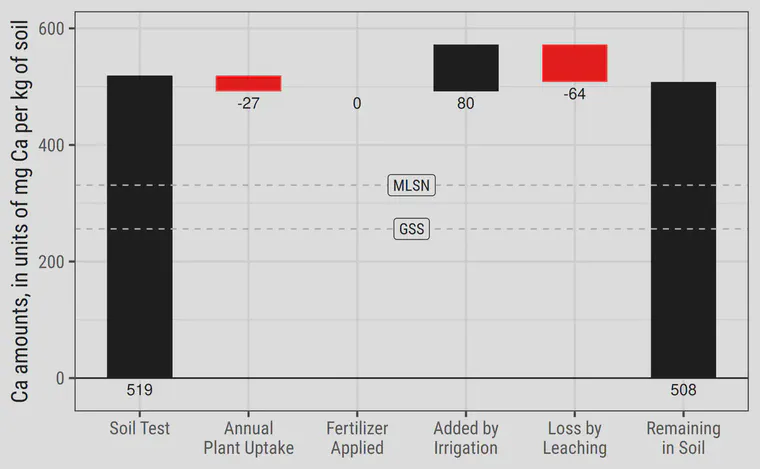
This waterfall chart for calcium (Ca) takes a look at the Ca in the soil and shows the various additions and subtractions of calcium over the course of a year. The typical quantities shown on the chart show why Ca is almost never required as fertilizer.
Here is an explanation of these data.
Grey dashed lines are drawn at 331 and 256 mg/kg (ppm). These are the MLSN and GSS values for Ca, which are known values of soil Ca at which high quality turf is produced.
The initial soil test level of 519 ppm is a typical level for sand rootzones. This is based on the median value of 100 soil samples taken from sand rootzones in five countries of Southeast Asia.
Annual plant uptake is expected to decrease the amount of calcium in the soil by 27 ppm in this example. This is based on an estimated annual harvest of 900 grams dry matter per square meter, with an average leaf tissue calcium content of 0.45%. This is typical of bermudagrass turf with a twelve month growing season. Use of calcium by cool-season grasses in a temperate climate would be about one-fourth to one-half the amount shown here.
No calcium is applied as fertilizer because it is not necessary. The amount in the soil is well above the minimum guideline.
I estimate an addition of 80 ppm calcium to the soil through irrigation water. This is based on an average calcium concentration in the irrigation water of 20 ppm, and an annual irrigation amount of 600 L/m2. This is a conservative estimate of irrigation application at Bangkok based on 150 days of irrigation at 4 mm per day. Note that the amount added by the irrigation water in this conservative case is three times the amount of calcium actually used by the grass. This is an important point regarding Ca. The irrigation water alone supplies more than the grass uses.
I estimate a leaching loss of 64 ppm (80% of what was supplied in irrigation). Calcium can be held in the soil, but in this case it absolutely has to leach. Why? Because the soil cation exchange capacity (CEC) does not change. The exchange sites in the soil already have cations reversibly adsorbed to them at the time the irrigation water is applied. So some of the calcium added through irrigation must leach. There is no place for it to remain in the soil.
Taking the initial amount of 519 ppm in the soil, subtracting the amounts used by the grass and lost by leaching, and accounting for the amount of calcium added in the irrigation water, we are left with 508 ppm calcium in the soil after one year. This is still well above the MLSN guideline for calcium and this demonstrates why none is required as fertilizer.