Blog
New posts
Top posts
Topic list
Podcasts
Soil tests
MLSN
OM246
Soil tests and other lab services
Projects
Article library
ClipVol
Project gallery
Shiny Apps
Newsletters
Seminar handouts
PACE Turf
About
About
Contact
Light
Dark
Automatic
science
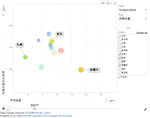
Motion Chart of Japan Climate Normals from 1981 to 2010
I’ve made an interactive chart for major Japanese cities using climatological normals data from the Japan Meteorological Agency. For a chart of global cities, in English, click here.
Micah Woods
Last updated on 2026-05-20
1 min read
«
Cite
×