The geometric mean as the central tendency (average) for soil nutrient data
Let’s start with the take home message. Soil nutrient levels vary. When there is a lot of variation, the average as we usually calculate it—as the arithmetic mean—can be higher than other methods of calculating the central tendency of the test results. Because fertilizer recommendations are often based on the average value, I prefer to use the geometric mean to calculate the central tendency of soil nutrient data. The geometric mean of a set of test results will be lower than the arithmetic mean. Using the geometric mean is safer, in that it reduces the effect of nutrient hot spots in the data. Over the long run, we’ll end up recommending a little more fertilizer.
I saw some phosphorus test results recently that I flagged with a note to use in the future to illustrate this.1 These were soil samples taken to a 10 cm (4 inch) depth from four different tees on the same golf course.
The Mehlich-3 P was 76 mg/kg (ppm) on the first tee, 298 on tee 7, 199 on tee 14, and 5 on tee 18. That’s all over the place! There’s almost 60x the P on tee 7 as there is in the soil on the 18th.
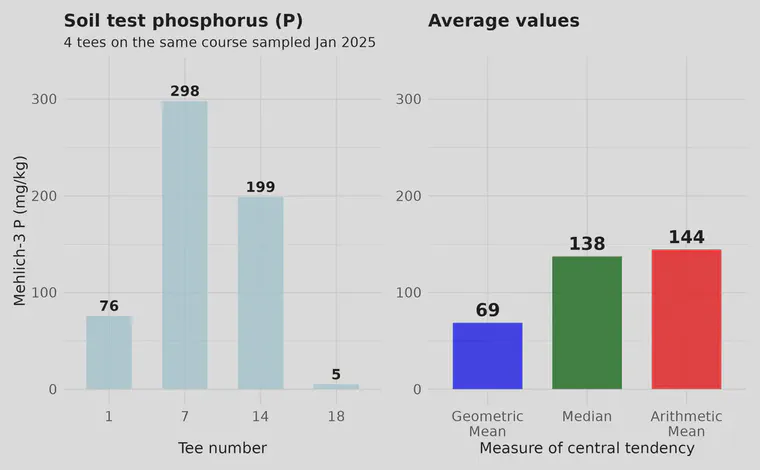
The figure above shows those values in the frame at left, and then three different calculations of the average, or central tendency, of those data. The geometric mean is the lowest, and the arithmetic mean is the highest.
I also made a figure that shows the potassium (K) values for those same tees. Compared with the P, soil K was more consistent from tee to tee.
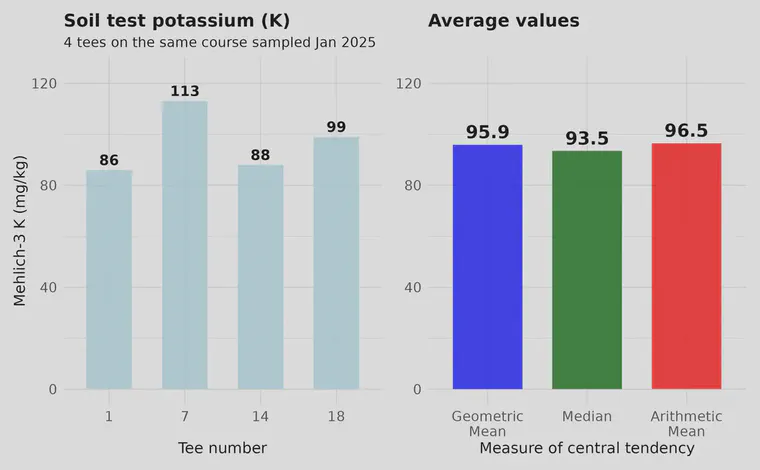
The figure above shows the soil test K on each of the four tees tested, along with three different averages. Note that as with the P data, the geometric mean is lower than the arithmetic mean. But in this case, because the soil test K was less variable, the geometric mean is less than 1 ppm lower than the arithmetic mean.
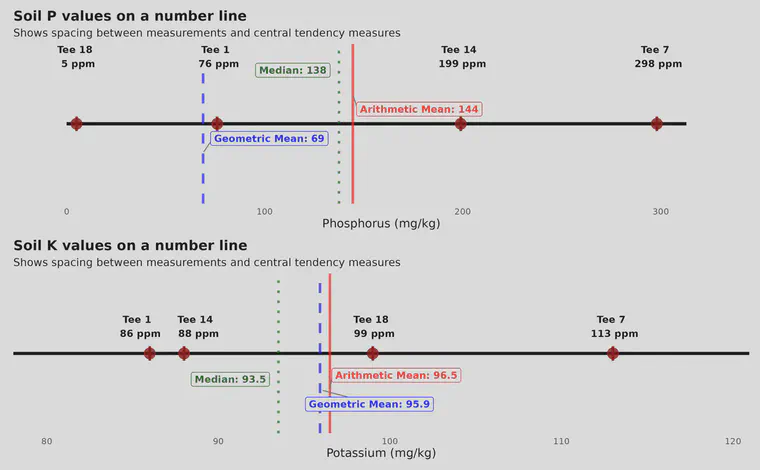
Those data are also represented on a number line in the figure above. Notice that the geometric mean is shifted lower than the arithmetic mean. The geometric mean is less sensitive to outliers than is the arithmetic mean, and because it is always lower than the arithmetic mean, the use of the geometric mean when making fertilizer recommendations based on soil test data is especially useful. Especially useful, that is, if your goal is preventing nutrient deficiencies.
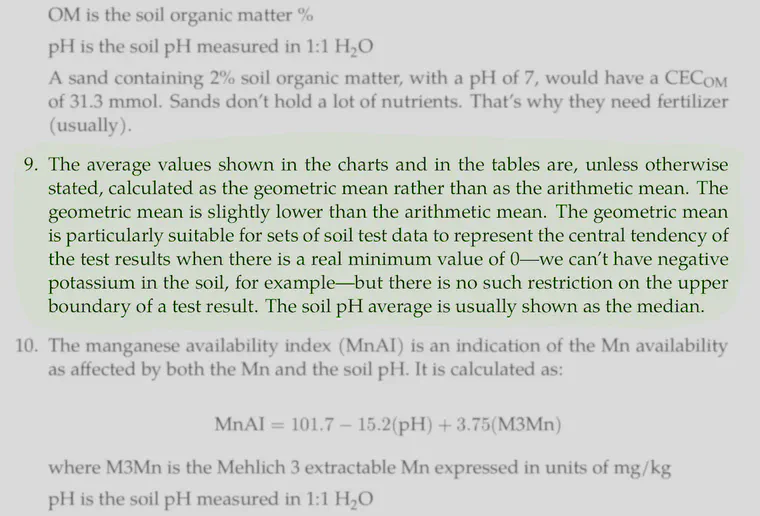
Item 9 above from Appendix A of a recent ATC soil report points out that for test results other than soil pH, the geometric mean is used to represent the central tendency. When the soil test results are extremely variable, the geometric mean produces a much safer value with respect to potential low nutrient locations across a sampled area. When the soil test results are less variable, the geometric mean will be almost identical to the arithmetic mean.
Another reason for this post is to check something related to the RSS feed of the ATC website. I have wanted to increase the resolution of the charts and images that show in the blog email that goes out to hundreds of people every time I make a new post. I made some changes to the RSS feed, and wanted a new post with some charts so I can check that. ↩︎