Hourly evapotranspiration, soil water content, and crop coefficients
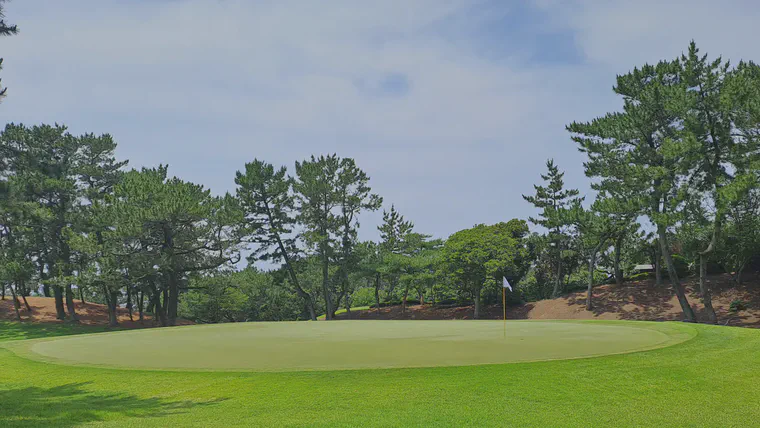
On June 9, 2023, I was at Keya Golf Club in Fukuoka, Japan. The final round of the Landic Challenge 10 tournament was played that day.

The weather was pleasant, with cloudy skies at sunrise giving way to partly sunny skies by 08:00 and then almost full sun from 10:00 to 15:00. I made my usual measurements of playing conditions and growing conditions.
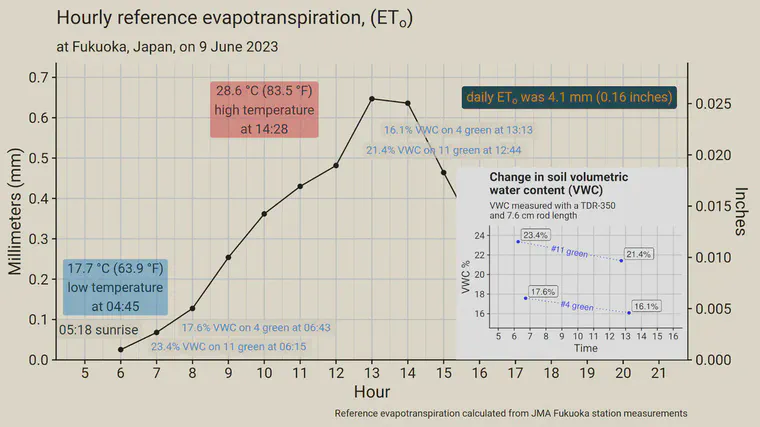
Those measurements included volumetric water content (VWC) of the 4th and 11th greens. I took nine measurements across each green and consider the mean value as that green’s VWC. The 4th green is surrounded by pine trees, has partial shade, and sits in a hollow that restricts air movement. The 11th green is at the top of a hill, is in full sun, and has unrestricted air movement.
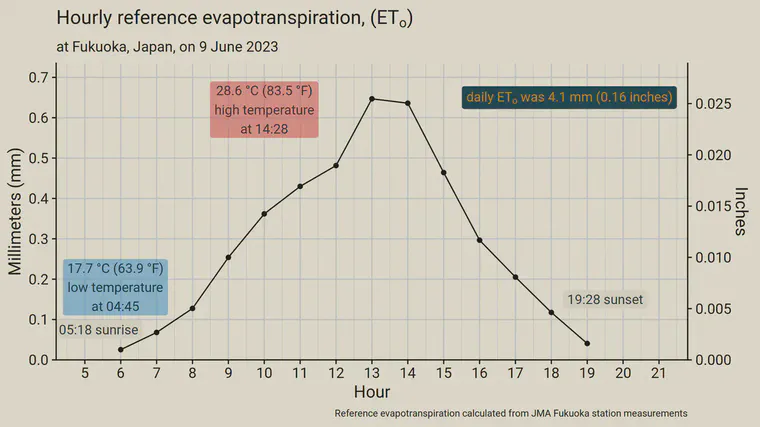
The reference evapotranspiration (ETo) on June 9 looks like this. Summing the hourly ETo gives a daily total of 4.1 mm (0.16 inches).

After getting those morning data, and making some calculations, I went for lunch at Natty Dread.1
After my delicious lunch, and after the final group had played the holes I measured in the morning, I went back on the course with my tools and took the same playability and growing condition measurements I had made prior to play. This included another measurement of VWC.
Some ETo had accumulated. I am going to look at how the ETo in the 6.5 hours between the morning and the early afternoon measurement is related to the change I measured in VWC from morning to afternoon. There was no rain and no irrigation applied in the 6.5 hours between the morning and afternoon measurements.
If you use the model that I do of a 10 cm deep rootzone, then a 1% change in VWC is equal to 1 mm of water added, or 1 mm of water lost. You can see more about this, and a way to do this in inches as well, in the soil water content turf hacks post. I find it easier to do the math in my head by doing this in metric—there are no fractions of inches to deal with—and I’ll use mm for the remainder of this explanation.
The ETo is a really useful number, but it is of course the output of an equation. The ETo is not what really happened. What really happened in terms of water use is the change in soil water content. For example, if there is no rain, and no irrigation applied, and if the VWC was 18% at 08:00 and if the VWC remains at 18% at 14:00, then no water was lost—no water was used—and that’s the reality. It wouldn’t matter if the ETo for those 6 hours was 2 mm. If the VWC did not change, then that is the reality.
Of course the ETo equation is really good, and it gets remarkably close to how much water the grass really does use. We just need to adjust the ETo by the crop coefficient (Kc) to get the amount of expected water use by the grass for the grass and growing conditions at our site.
Because I know the VWC at known times of the day, and because I calculated the hourly ETo on the same day, I can get an estimate of what the Kc is for those two greens at Keya GC.
The accumulated ETo from the morning VWC measurement time to the afternoon VWC measurement time was 2.3 mm. If the Kc were 1, then I’d expect the VWC to go down by 2.3%.
For warm-season turf—the greens at Keya GC are korai (Zoysia matrella)—it is customary to use a Kc of somewhere around 0.6 or 0.7. The VWC went down on #4 green by 1.49%. That’s an apparent Kc for #4 green2 of $\frac{1.49}{2.3}=0.64$.
On #11, which is in full sun and has more air movement, the VWC went down from the morning to the afternoon measurement by 1.95%. That’s a water loss of 1.95 mm, and an apparent on-course Kc of $\frac{1.95}{2.32}=0.84$.
There was more water in the 11th green that morning than there was on the 4th. That difference in starting VWC is expected to have an effect on the grass water use rate as well. When the soil gets drier, the grass will use less water.
Obviously, two half-day measurements don’t provide much information, and I wouldn’t assume that the Kc should be 0.64 for the 4th and 0.84 for the 11th. This post is to show how easy it is to switch between soil VWC measurements and ETo calculations and water use rate assumptions and from those to calculate a site-specific (Kc). Do this for a few more greens, however, for a few more days, and you’ll quickly get a reliable number that you can work with.
It’s a tradition to eat one meal per tournament week at this classic jerk chicken/hamburger restaurant in Itoshima. Get there early if you want a parking spot or a table. ↩︎
If you are reading this in the RSS feed or by email, the equations won’t display properly. They require MathJax to display and that only happens when the post is rendered in a web browser. ↩︎