Reconstructing soil P from "disassembled" soil samples
This is one of the many interesting things I’ve been working on recently. A standard soil test for turfgrass is taken to a 10 cm depth (4 inches below the soil surface).1 But there can be large differences in soil properties within that 10 cm depth.
Let’s take phosphorus (P), for example. Everyone knows that P is relatively immobile in the soil. The assumption is that if one applies P, the P will stay in the soil close to the surface, and the surface layer of soil may eventually have an elevated P concentration compared with soil deeper in the rootzone. Of course if there is a lot of P in the soil, then one may not apply P fertilizer, and then P will remain high deeper in the rootzone while decreasing in concentration closer to the soil surface.2
Because of gradients with P (and with some other soil properties), I now recommend submitting 20% of the soil samples from a single sampling of putting greens as samples separated by depth at 5 cm (2 inches) below the surface. The 0–5 cm soil conditions can be checked, the 5–10 cm soil conditions can be checked as well, and then those depth samples can be reconstructed into the 0–10 cm “standard” soil test equivalent for that location too.
I’ll show here the results from samples collected from nineteen different putting greens (from different courses and grass types) in a recent research project. On each of those greens, a composite soil sample was collected with five 18 mm diameter subsamples combined into a standard soil sample, at a 0–10 cm depth. From those same greens, a single 4 cm diameter core was divided into 0–5 cm and 5–10 cm segments, and each of those depth samples was submitted to the lab for testing as well.3
How much do you think the soil P, as measured by the Mehlich 3 extraction, varied between the upper (0–5 cm) and the lower (5–10 cm) layers of the rootzone? It depended on which course was sampled. From those nineteen greens, the mean P in the upper layer of the rootzone was 49 ppm and the mean P in the lower layer was 92 ppm. One green had 248 ppm more K in the lower layer than in the top layer. 248 ppm!! The top of that rootzone was at 48 ppm and the bottom of that rootzone tested at 296 ppm. Another had 155 ppm more P in the lower layer. That one was 65 ppm in the 0–5 cm layer and 220 ppm at 5–10 cm depth. Fourteen out of the nineteen greens tested had more P at the 5–10 cm depth than at the 0–5 cm depth.
I find it useful to know what that gradient is. On some courses, the gradient is reversed. For example, one of these greens had 19 ppm in the upper layer and only 10 ppm in the lower layer.
Once I check that gradient, I then reconstruct or reassemble the sample. I do that by combining the 0–5 cm and 5–10 cm layer test results, making an adjustment for soil mass based on the difference in soil organic matter content between the upper and lower layers.
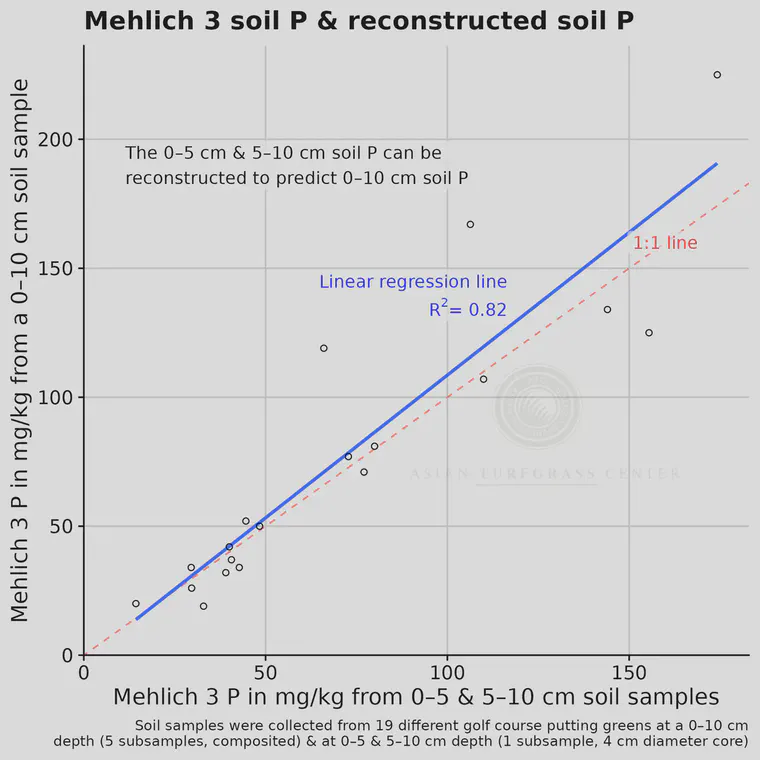
The chart above shows that there is a predictable and nearly 1:1 relationship between the “reassembled” soil test value obtained by calculations on the 0–5 cm and 5–10 cm depth samples, and the “standard” soil test value from the sample taken to a 0–10 cm depth from the same green.
My recommendation is to take soil samples to a 10 cm depth as a standard, unless you have a good reason to sample at a different depth. In New Zealand the standard is 7.5 cm depth, I understand. That would be an example of a good reason to sample at 7.5 cm depth rather than at 10 cm. ↩︎
All these samples were tested at Brookside Labs. ↩︎