Turfgrass soil sampling, part 7 of 7
Checking the variability on a golf course putting green
The summary so far is this:
- standard recommendations for turfgrass sampling are to take 12 or more cores from each area and composite them into one sample
- I’ve been taking 5 cores and compositing them
- Donohue’s research in Virginia led him to recommend taking 20 subsamples and compositing them
- The article by Lawrence et al. suggests that cores should not be composited
I’ve been wondering if my usual practice of 5 subsamples per green were enough (or too many). Last year I took 30 cores from a 1,092 m2 double green in Bangkok and tested them individually. That works out to 1 sample every 36 m2.

I made some calculations about the number of samples required. I’ll use the Mehlich 3 phosphorus results as an example. These are the soil test phosphorus data for those 30 cores in units of mg/kg.
31 23 29 25 25 29 24 27 26 20 19 30 29 23 24 28 21 24 32 32 22 20 33 24 23 34 24 25 24 21
I took random draws from those results, selecting 1 core, or 2, or 3, all the way up to 30 cores. And from those cores that were randomly drawn, I calculated the geometric mean, as recommended by Lawrence et al. I did that 200 times, and then plotted the means that were obtained from taking 1 up to 30 cores. This is simulating composite sampling from 1 core up to 30 cores on the same green.
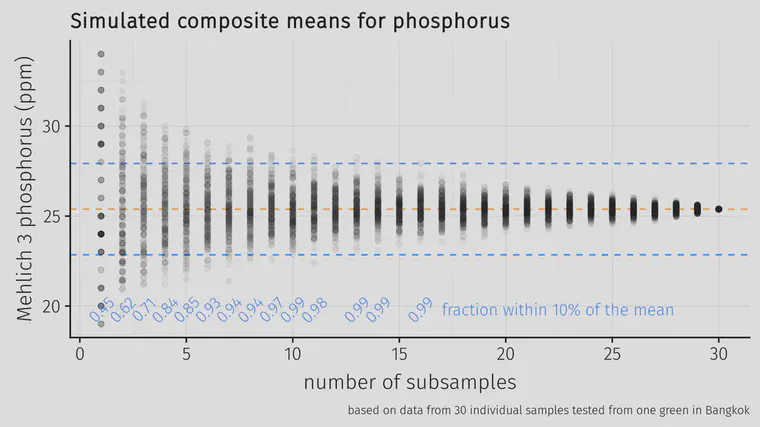
Looking at the fraction of the simulations that returned a mean within 10% of the known mean, the fraction goes above 90% (marked with a horizontal dashed line in the chart below) once there were 6 or more subsamples.
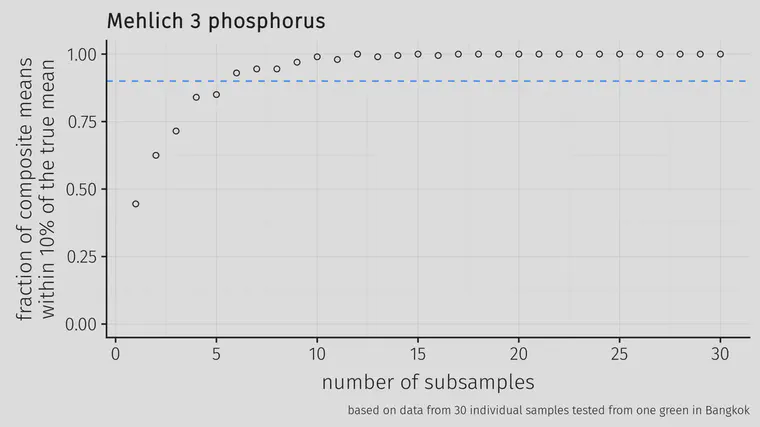
For phosphorus, once 6 cores were composited from this area, the mean soil test P was within 10% of the known mean more than 90% of the time.
I made the same calculation for other elements, and it was 6 subsamples for K, 5 for Ca, 4 for Mg, and 6 for S.
This green was 1,092 m2 so 6 cores from this area would be 1 core from every 182 m2. Another way to express this is 0.55 cores required per 100 m2 or 0.51 samples required per 1,000 ft2. That’s how many samples would be required to get a test result within 10% of the true mean of the area, 90% of the time.
The 5 subsamples I’ve been compositing per green is about twice that sampling density; if nutrient variability within the green I tested in Bangkok is similar to other greens, then I am probably getting a mean value within 10% of the true mean almost 100% of the time.
The implications of all this include:
- a few subsamples per green are probably enough to get a result close to the mean value of the green
- current recommendations for 12 or more subsamples seem to be excessive, but I need to check variability on more greens
- testing individual cores, rather than composited samples, is probably a better way to do soil testing