Phosphorus deficiency symptoms in the control plots
Paul Johnson reminded me of another experiment about P deficiency, soil test P, and fertilizer
After last week’s post about the soil test levels where P deficiency symptoms were seen, Paul Johnson wrote to remind me about another experiment:
“This is always a topic of interest to me, beginning with the study I did in the early 2000s. It’s also the reason I’ve continued to be intrigued by the MLSN guidelines and convinced grasses don’t need much to perform well for our golf courses and other turf areas.
If I remember right, your work at Cornell used that study to some extent. I can’t seem to find a copy of my paper at the moment, but I remember seeing deficiency symptoms in the control plots (no P applied) like your photo here and a soil test P (Olsen method) of 2-3 mg/kg). As soon as even a small amount was applied, the symptoms went away. So either a small change in soil test P made the difference or in combination with some foliar uptake.”
Paul is referring to Nitrogen, phosphorus, and potassium responses and requirements in calcareous sand greens by Johnson, Koenig, and Kopp. He’s right that I studied that paper quite a few times when I was in graduate school. I looked up my copy of that article, made a few calculations to send back to Paul, and found it so interesting that I wanted to share it here.
They grew Providence creeping bentgrass in a calcareous sand green (pH of 7.7, CaCO3 equivalent of 3.2%) with an Olsen P at the start of the experiment of 2.5 ppm. I’ll round that up to 3 ppm.
Then they applied the same rate of N (24 g N m-2 yr-1) to all the plots, and P rates of 0.6, 2.8, 5.5, and 11 g P m-2 yr-1. What happened?
From the results section of the article:
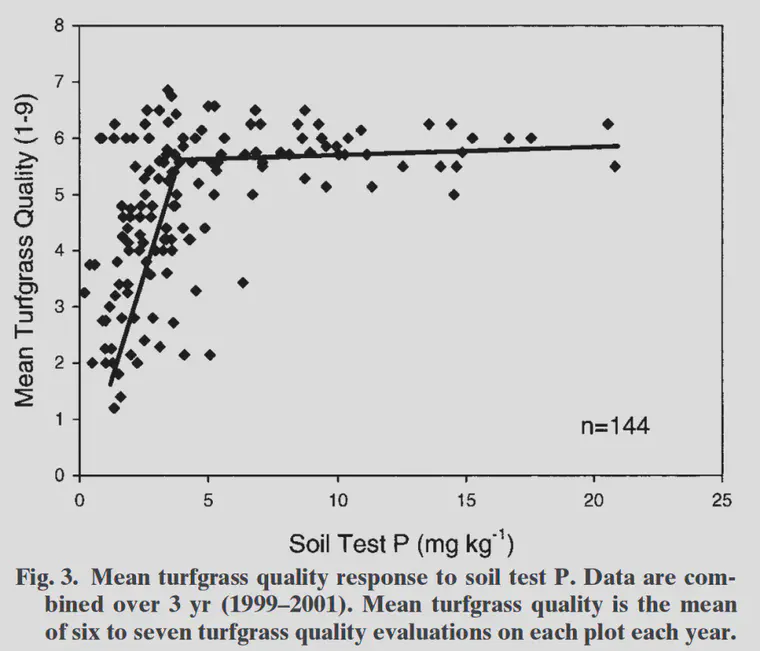
“Creeping bentgrass turf responded to P treatments soon after the experiment began. Before the experiments, the turf was lacking density, and leaves exhibited characteristic purple deficiency symptoms. Plots receiving 5.5 kg P ha-1 yr-1 [I’ll round this to 0.6 g P m-2 yr-1] had significantly reduced quality (3.0 out of 9 on the turf quality scale) and were deficient as evidenced by the purple leaf coloration. The remainder of the P treatments produced statistically similar results ranging from 5.3 to 5.5 on the turfgrass quality scale … According to linear plateau regression analysis, soil test levels beyond 3 mg P kg-1 soil and tissue levels above 0.4% did not result in increased turfgrass quality.”
This is Figure 3 from the article showing the relationship between the soil test P (Olsen method) and the turf quality.
How is this related to MLSN? It is another example of the MLSN guidelines, and the associated fertilizer recommendations, being generous. This is something I explained in a full seminar (slides, handouts, and videos in both English and Spanish at the link) for Campus del Césped that I called How to prevent nutrient deficiences AND use less fertilizer.
I’ll work through the calculations to demonstrate how the MLSN recommendations are related to the Johnson et al. results.
The first version of the MLSN guidelines from 2012 had an Olsen minimum of 6 ppm. The soil in the Johnson et al. experiment was at 3 ppm. So from the start, that soil would be classified as too low by MLSN, and P fertilizer would be recommended. How much fertilizer would be recommended by MLSN?
To get that, we’ll use the a + b - c = Q calculation, described here:
First to get a, the site specific use estimate. The N rate was 24 grams. I expect bentgrass to use 0.125 g P for every 1 g of N, so a is 3 g.
Next is b, the MLSN minimum guideline. In this case we have Olsen soil test data, so we can use the MLSN value of 6 ppm for the Olsen extractant. Units of ppm are of no use to me, because I want to get a fertilizer recomendation, so I’ll assume a rootzone depth of 10 cm and a soil bulk density of 1.5 g cm-3. That gives me a conversion factor of 6.7 ppm = 1 g spread on 1 m2 and then distributed through the top 10 cm. I’ll round this 6 ppm up to 1 g.
Finally I need c, the amount of P from the soil test. This was 2.5 ppm and I am rounding it up to 3, and then letting that be 0.5 g, which is about 3/6.7.
The annual MLSN P recommendation for this site would be 3 + 1 - 0.5 = 3.5 g P m-2.
Let’s check that recommendation against what happened in the experiment. When 0.6 g P was applied, and that is about 17% of the amount recommended by the MLSN approach, there were P deficiency symptoms. When 2.8 g P were applied, or 80% of the amount recommended by MLSN, the deficiency symptoms were gone, and turf quality was just as high as in the plots receiving 5.5 or 11 g of P.
You may not read these research articles or work through the comparative calculations to check, but we do. So when we find a case when MLSN doesn’t prevent nutrient deficiencies, we’ll be sure to share that too.