The last year of DLI with weekly averages
A previous post showed photosynthetically active radiation (PAR) data in units of daily totals—the daily light integral (DLI). That post included a chart with a locally smoothed regression line through it. Some feedback from that post prompted me to make some more charts with the same data. This time, I made them with horizontal lines that show the average for each week. Like this.

That chart shows the DLI each day for the past 55 weeks. A little more than a year. And there are horizontal lines that show the average for each week. These calculations were made for weeks that begin on Sunday and end on Saturday. And I color-coded the weekly average lines to indicate whether they were greater than or equal to 40 mol m-2 d-1, or not.
I like to use that 40 DLI level as an indicator of “no-problem” light levels for bermudagrass (Cynodon) putting greens.
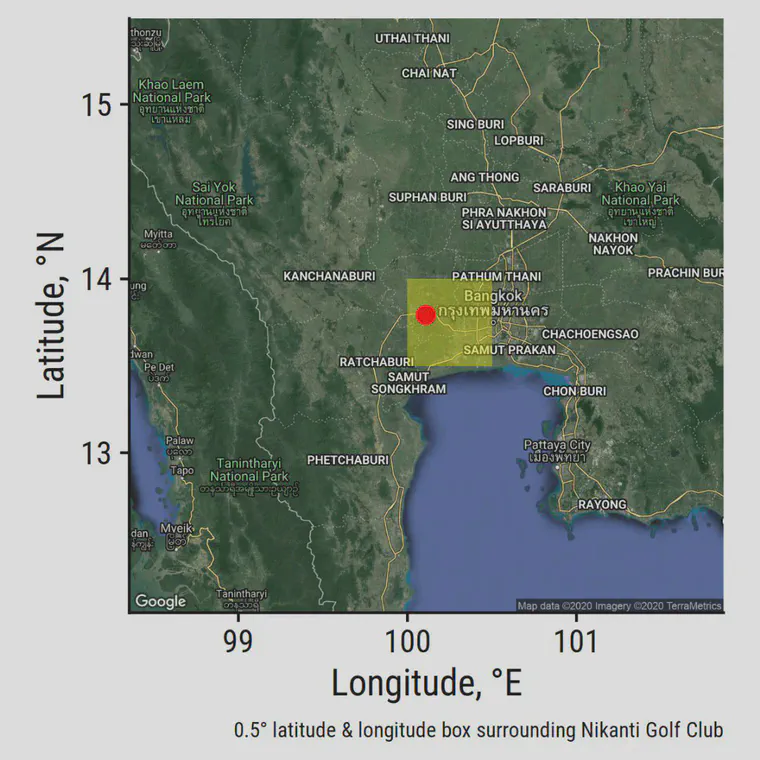
The chart above is for this region just west of Bangkok. The location of Nikanti Golf Club (I’ve written about Nikanti before) with its Tifeagle ultradwarf bermudagrass greens is marked on this map.
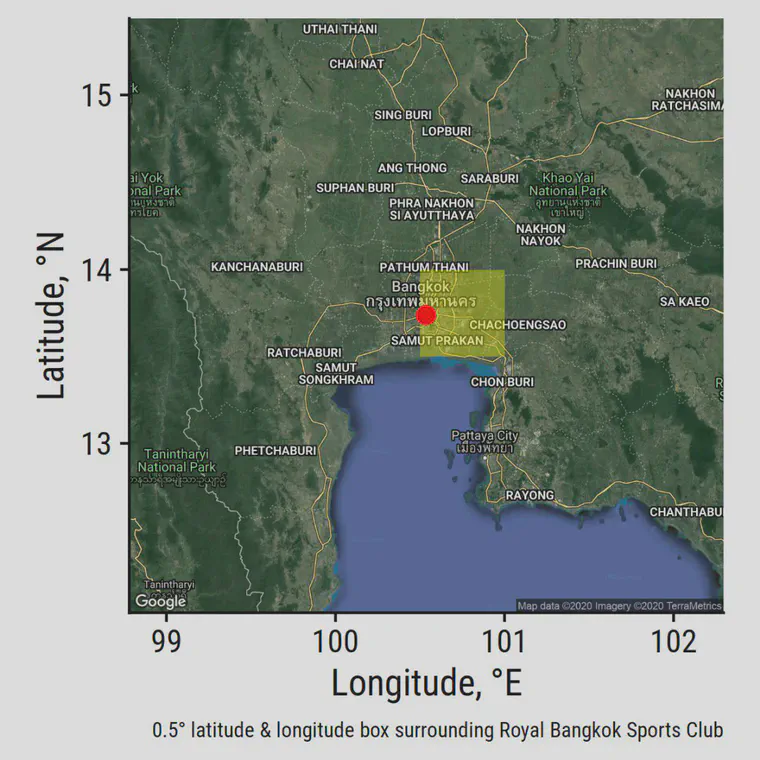
The Bangkok region just to the east of that has virtually identical DLI. It’s all in the same river delta, basically. Here’s that data, half a degree of longitude to the east, in this case with Royal Bangkok Sports Club (manilagrass greens) marked.
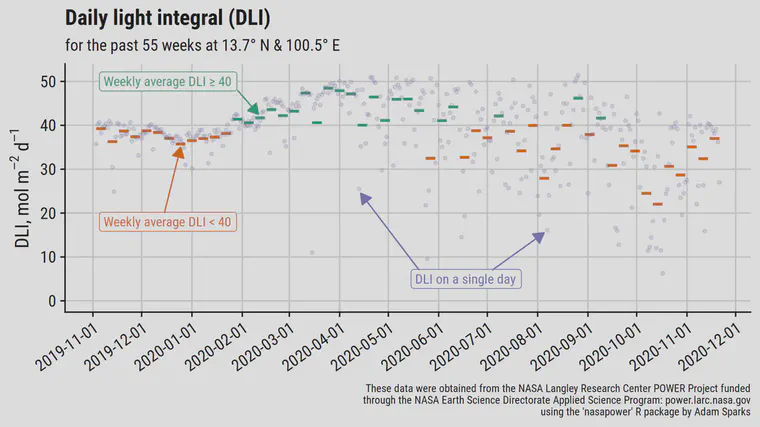
Those charts show that there is DLI above 30 for almost all of the year near Bangkok. The DLI dropped below 30 for a few weeks during the rainy season this year—for four weeks, to be exact. Of course on individual days the DLI dropped below 20 sometimes. And those “no-problem” weeks when there is plenty of light for bermudagrass? Those happen during the end of the dry season, in the tropical summer of Bangkok that happens from February until May.
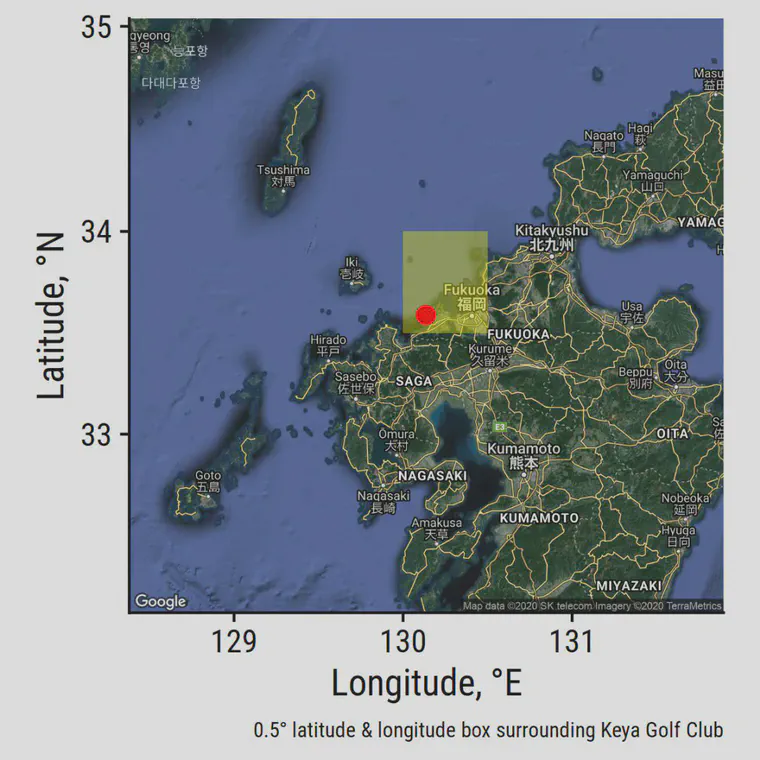
Things get a bit more complicated (or interesting?) when we look at a place like Fukuoka. Going this far north causes a big difference between summer and winter.
Now there is the winter when the sun is far away and even on days with full sun the DLI maxes out at about 25. But check out how many weeks there were in the last year with an average DLI above 40. Only six weeks!
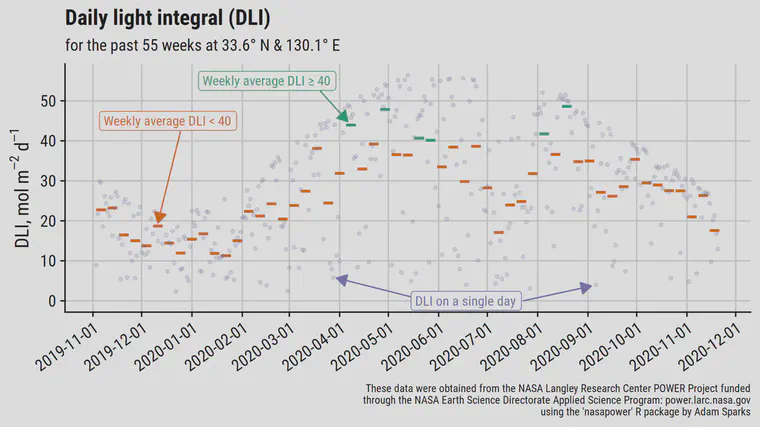
And four of those weeks were in the spring, where temperatures are way below optimum for warm-season grasses. Only two weeks in August with an average DLI above 40. There’s a reason zoysia is ubiquitous in Japan.
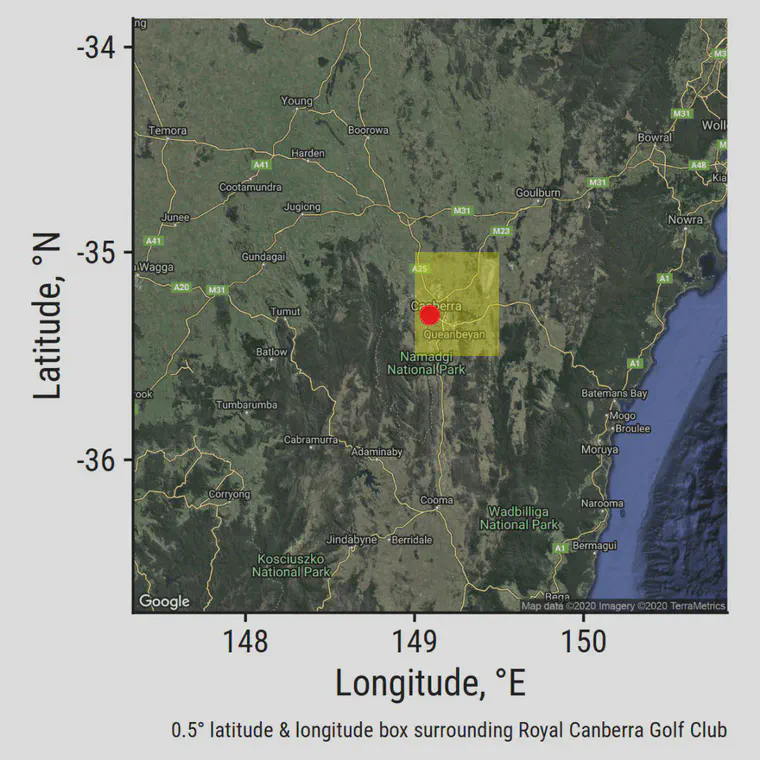
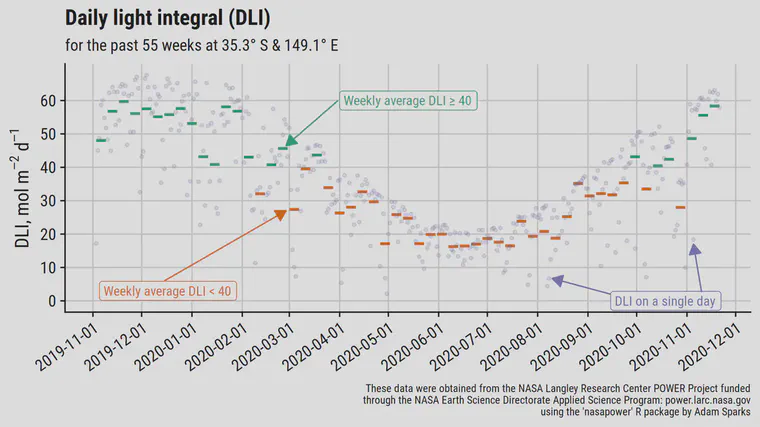
How about another location a similar distance from the equator? But this time, in another direction. I looked at data for the half degree latitude and longitude boundary around Royal Canberra Golf Club, at 35.3° south.
This looks different. Clearly a lot more PAR during summer than is seen in Bangkok or in Fukuoka.
It can be useful to know the DLI for your location for a lot of reasons. I won’t belabor them here, but you might make use of NASA POWER data to find DLI for your region, wherever you are in the world. If you are interested in normal DLI data for the USA, this high resolution map shows DLI through the year.