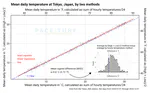
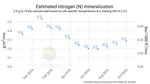
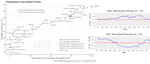
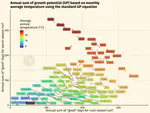
A previous post showed photosynthetically active radiation (PAR) data in units of daily totals—the daily light integral (DLI). That post included a chart with a locally smoothed regression line through it.
I’ve been using the NASA POWER agroclimatology data for a few projects. I get the data using the convenient nasapower R package by Adam Sparks. There is also a web-based map data access viewer.
The median blog post on this site in 2019 got 244 views. And there were a few up around 1,000 to 2,000 views.
There were these top 10 that everyone read.
I’ve been at Keya Golf Club for the KBC Augusta tournament this week. Yesterday afternoon I watched some shots during the first practice round, and took a few videos of ball reaction on the greens.
Regular readers of this blog will be familar with some previous attempts to estimate the N mineralization in turfgrass soils. There was this from 2010, which I wrote about in 2015 saying “I wouldn’t explain it this way again.
Yesterday I saw some dollar spot on a korai (Zoysia matrella) fairway in Kyushu, Japan. I wondered what the Smith-Kerns model probability for dollar spot had been.
So I looked up the recent temperature and humidity at a nearby weather station.
I’ve written about reactive greenkeeping being at least a viable option, and have implied that it is preferable to proactive greenkeeping. With a little effort, one can get information (data) about the weather, the amount of water in the soil, the quantity of nutrients in the soil and the quantity of nutrients used by the grass, the growth rate of the grass, and so on.
Yesterday I wrote that bermudagrass fairways in Thailand wouldn’t be as good as they are in the Algarve because of climate differences. The cumulative rain so far this year makes a nice illustration of this.