Bobble test and roll distance
Some notes about the methodology of the bobble test
I’ve used many different methods to assess the quality of ball roll on putting greens. This is not the distance the ball rolls—that measurement is commonly called the speed of the greens. When I say quality, I mean how smooth and true the surface is. For background information about this topic, please see these items.
The bobble test section of “How to measure the smoothness of golf course putting greens?” video
Chart showing almost a full season of bobble test data from Hazeltine National GC
Jon Wall asked an interesting question about this.
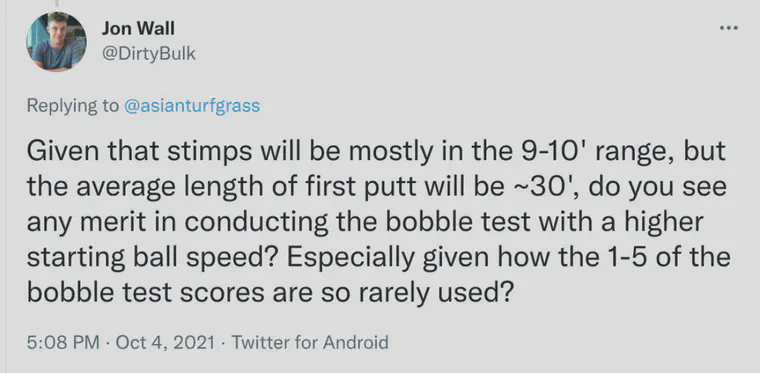
My short answer to this is no, I don’t think one will get additional information about the trueness and the smoothness of the green from longer rolls with a higher initial rate of motion.
Here’s a three part answer explaining why.
1. The ball’s rate of motion during the test
I expect one is more likely to notice snaking as the ball rolls more slowly across the surface. I notice the lateral deviation when the ball moves slowly.
US Open conditions come to mind, when some areas of the green wilt and others don’t. In this situation, the ball rolls true until it slows down, and then the snaking becomes prominent. Or there is the case of zoysia greens, where one might observe a ball reversing direction at the end of its roll, or even coming to a stop but spinning in place. These deviations from true roll are only seen when the ball is rolling slowly—in this case as it comes to a stop.
As for bobble and chatter—the vertical deviation from a smooth roll—those might be more pronounced when the ball is moving more quickly. I can say that after performing this test on many greens, I have not yet thought that I was failing to assess bobble or chatter by rolling the ball the stimpmeter distance. That is, if I would perform the bobble test with a stimpmeter, and then hit longer putts across the same green, there has not yet been a case where I’ve thought the bobble test did not match with my putting observations. Now that Jon has brought this to my attention, I’ll be paying more attention to the possibility of a discrepancy when I make these tests in the future.
2. The scale of scores for the bobble test
I’m not sure how rolling the ball a longer distance, by increasing its initial rate of motion during the bobble test, would necessarily expand the scale of scores being assigned. When a green gets a bobble test score of 6, for example, I would expect to see the same score for a ball rolled 30 feet as for a ball rolled 10 feet.
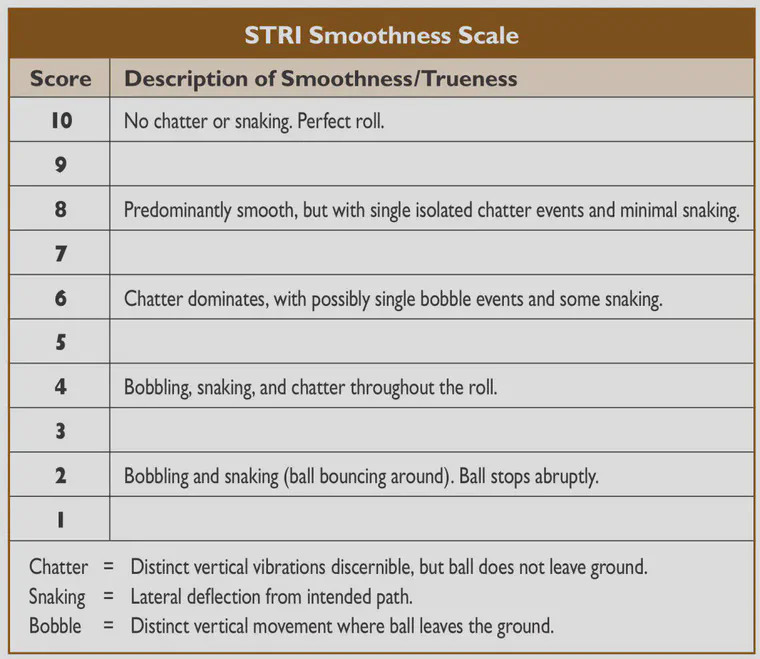
Linde et al. measured this in the final meter of the roll. I assess this over the entire roll, omitting the initial bounces as the ball exits the stimpmeter.
I’m not too concerned with the scale and using the full range of it, either, because my objective for any green would be to have a score of 8 or higher. In that way I am looking to maximize the number of days in the year in which the bobble test score is at 8 or higher.
I have measured many greens with scores of 4 and 5, and I don’t recall measuring any less than 4 but I have certainly played golf in conditions of 1, 2, or 3. Because all those conditions exist, it makes sense to me that they are on the scale.
A further note about the scale. The STRI article about the method says to measure the bobble test with twelve rolls on a green. Basically, do this as a stimpmeter measurement at one location on the green, then do a stimpmeter measurement at another location on the green. This is twelve rolls that each get a score. The average of those rolls is rarely an integer.
Another common way to do this would be to assess the bobble test for a set of greens, by doing six rolls on multiple greens. If one does this at the same time as stimpmeter measurements, and does a single stimpmeter test on three greens, that is 18 rolls to average for the bobble test score. Again, that is rarely an integer.
I’ve used the example of Hazeltine National GC data, and the range of daily bobble test scores in 2021 so far has ranged from 6 to 9.75. The effective range, if one assumes we go to a single decimal point, would be 6 to 9.8, or 38 possible values in this sequence:
$$\{6.0, 6.1, 6.2, 6.3,\dots9.8\}$$
3. The linear distance of the green being evaluated
The dispersion tests conducted by Reasor et al. used a Perfect Putter with a ball dropped from a release hinge at 70 cm above the surface. Twenty balls were rolled in a downhill direction. The dispersion area (derived from the length and width of the 20 stopping points) was recorded. Then the 20 balls were rolled in the uphill direction.
Doing this test on 65 different putting greens produced roll distances ranging from 2.9 m (9.5 feet) to 14.2 m (46.6 feet). If rolling the ball a longer distance across the green produces a more sensitive measure of dispersion, then Reasor’s data might show that.
I find it convenient to express the dispersion area as the radius of a circle with an area the same size as the rectangle that enclosed the stopping points of the 20 rolled balls.

The chart above shows those dispersion radii for 65 greens, and the chart below separates those in one plot for each green, to show that the slope is almost always positive. Except for green ID number 16, the longer the distance a ball rolls, the more dispersion there will be. That is no surprise. On an average green, the dispersion radius increases by 5 cm/m.

The reason I’m bringing up these data in relation to the question Jon asked, about whether I see any merit in performing the bobble test across a longer distance, is because of what happens when the Reasor dispersion data are expressed in terms of dispersion radius per meter rolled.
The dispersion from those same 65 greens can be expressed as the radius of dispersion per meter rolled, and can be plotted again against the meters rolled. Remember, there was at least one set of uphill and downhill measurements per green. The slope of this relationship provides information about the change in dispersion at different distances.

The median slope here is 0.07 cm/m/m. I round it up to 0.1 cm. This is negligible. On average, for every additional meter rolled, the radius of the dispersion area of 20 balls goes up by 0.1 cm. Because there is such a small average increase in dispersion as the distance rolled increases, I don’t expect rolling the ball a longer distance will capture more green imperfections in the bobble test either.