Grass clippings year to date
One can look at clipping volume as a cumulative amount through the year, and can compare to previous years and to the average of all areas being measured.
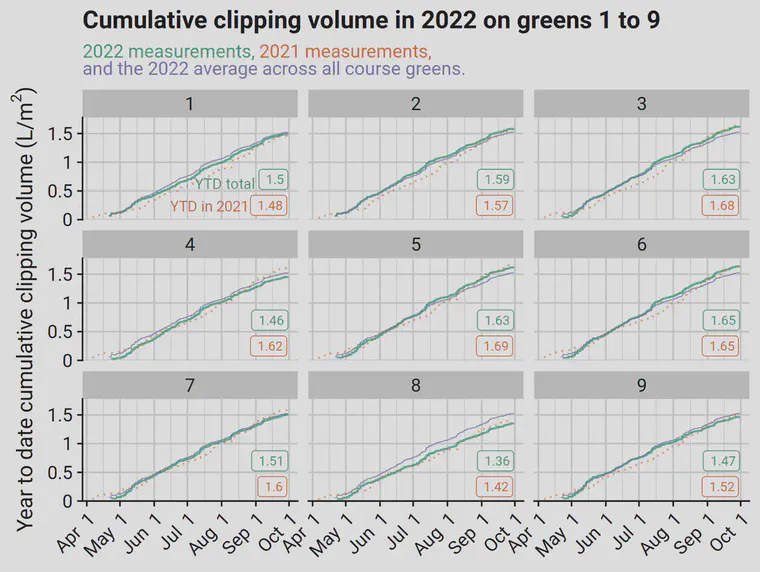
One way that I like to look at clipping volume measurements is to plot the cumulative amount of clippings collected. This enables one to compare clipping amounts year to year. Considering the cumulative amount over time also makes it easy to see which areas are growing more, and which are growing less.
For example, in the chart above, I’ve plotted creeping bentgrass clipping volume data for the putting greens on holes 1 to 9.
On green 1, there have been 1.5 L/m2 harvested from late April through September. That’s an average of about 10 mL/m2/day. For much of the season on this green, the clipping harvest was more than in 2021. The clipping volume through June and July and August on the first green was also a little below the average of all the greens on this course in 2022. By the end of September, those differences are gone, and the 2022 cumulative clipping volume is about the same as the average and about the same as it was on this green in 2021.
Or have a look at the 8th green, which produced below average clippings in both 2021 and 2022. Or green 5, which by the end of September is a little behind where it was in 2021 in terms of clipping production, but still is growing more than the average green on the course this year.
For more about the measurement of clipping volume, see One Bucket at a Time.