Simulating a normal green speed range
A question came in about green speed. I paraphrase it here:
If our peak season target is 10. What is a reasonable deviation from that? We would then aim to hit that 80% of the time to account for weather and cultural practices. What would you think would be a reasonable greenspeed range for daily KPI tracking? Is +/- 6" unrealistic? Does anyone have data to support this? We are setting up surface performance KPI tracking and want to make sure that they are reasonable.
I’ve made quite a few measurements of green speed. From those measurements, I’ve found that intensively maintained greens prepared at a level matching tournament conditions can be approximated by a normal distribution with a 3.3% coefficient of variation.
With that information, we can answer the question about the “80% of the time” range by making a calculation of what the green speed would be under those conditions.
First, I simulated a June 10 to September 10 season in 2025—a total of 93 days. If we would measure the speed on three greens each day, and then calculate the course average from those three measurements, the results could look like the green speeds plotted on this chart. This is one of an infinite number of series. These results come from a pseudo-random number generator.
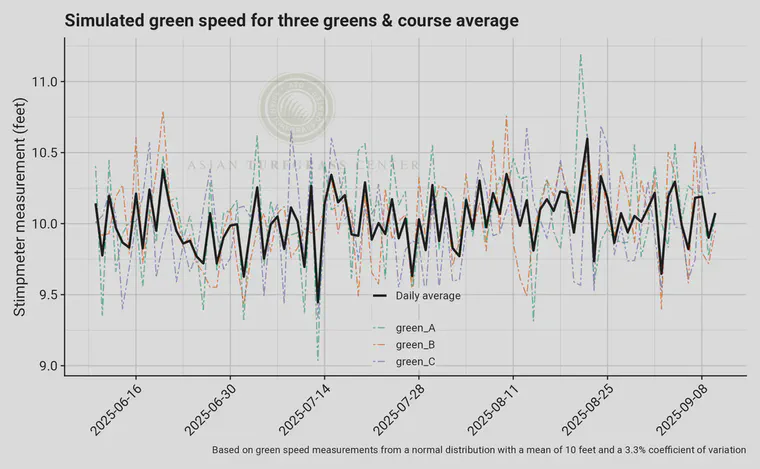
For that particular season, the lowest speed for an individual green was 9 feet, and the fastest speed for an individual green was 11.2 feet. The daily average ranged from 9.4 to 10.6 feet, with a mean of 10 feet.
But we don’t really want the range, and we don’t want to consider only this one possible season. What we would like to know is what the middle 80% of these measurements would be, in order to have a range we could try to stay within 80% of the time.
To quickly get at that number, I simulated this for 1,000 seasons, generating 93,000 daily average green speed measurements. Then I found the range from the 10th to 90th percentile, which will give us 80% of the days with a tournament level deviation from the desired average speed.
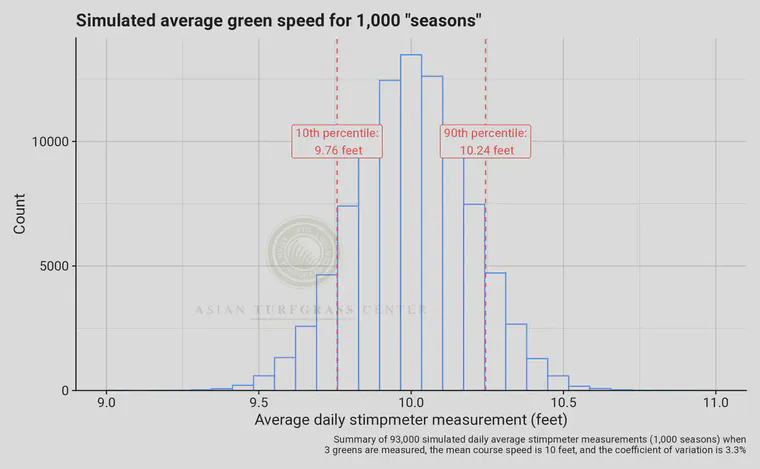
In this case, with the hypothetical target of 10 feet, and calculating the course average from stimpmeter measurements made on three greens each day, the reasonable range is from 9.76 to 10.24 feet. That’s 9 feet 9 inches to 10 feet 3 inches.
This same approach can be used to find a normal range for other target speeds and for other numbers of greens measured to calculate the average.