Numerical notes from Nikanti GC
I spent a morning with Brad Revill at Nikanti GC last month. I wanted to see the course, get some measurements, see the clipping volume measurement, and talk about turf management with Brad. Check out his blog for information about the innovative techniques he’s been using.
I’ve now had a chance to work through some of the measurements made that day, and the best way I can think to explain them is in a list of numerical notes.
Clegg, Trufirm, and TDR-350
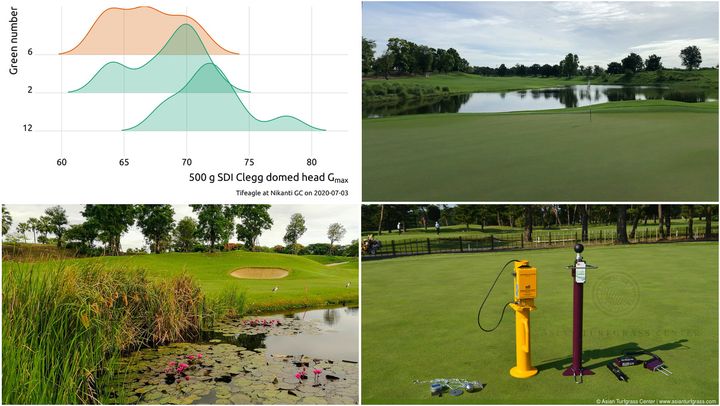
I brought my Clegg—the SDI golf course firmness tester with a 500 g domed-head hammer—and measured surface hardness on three greens.
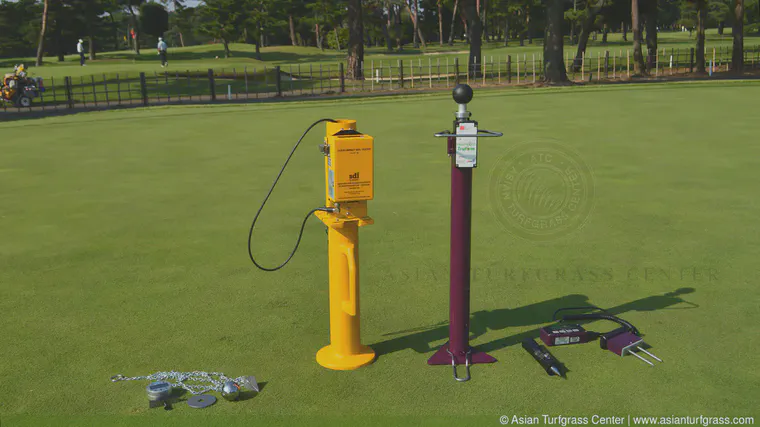
Brad used a Spectrum Trufirm to measure surface hardness on those same spots, and we also used a Spectrum TDR-350 to measure the volumetric water content (with 7.6 cm rods) on those same spots.
In previous side-by-side measurements, I’ve not gotten very close correlation between the Clegg and the Trufirm. That’s what we saw in our measurements too.
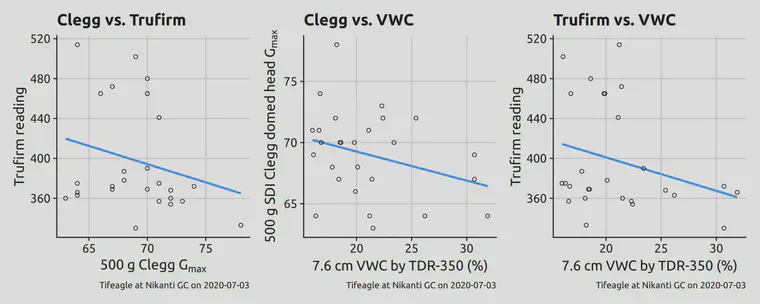
In these three charts you’ll see two things that make sense, and one that doesn’t. Starting in the panel at far left, notice how the Trufirm reading goes down when the Clegg reading goes up. That’s what is expected. Both devices are measuring surface hardness. With the Clegg, the surface is firmer (harder) when the number gets larger. With the Trufirm, the measurement goes in the opposite direction—a smaller number means the surface is firmer and a ball won’t make such a deep indentation. A larger number on the Trufirm means the surface is softer and a ball indentation will be deeper.
The center panel shows the Clegg measurements compared to the volumetric water content. This is also as expected. When there is more water in the soil, the surface tends to be softer.
The panel at right shows something that doesn’t make so much sense. Some of the softest Trufirm readings were at the driest soil water content, and some of the firmest readings were at the wettest.
Here are some summary points about this:
The green surfaces were a bit soft, with these measurements taken four days after a 4 mm coring treatment (Ninja-tine).
This type of poor correlation is expected when measuring intensively maintainted turf at the same property, because the surfaces are essentially all in the same condition. Where one could get better correlation would be, for example, at a property where there were localized dry spots all over the greens and soil moisture content ranged from 5 to 30%. In that case, where the surface conditions vary tremendously, then one would see better correlation.
The Clegg is my favorite
Compared to all the other tools for measuring surface hardness, I find the Clegg easiest (fastest) to use. That’s important. I also find to produces more accurate results. That’s important too. I’ve written before about my preference for the Clegg.
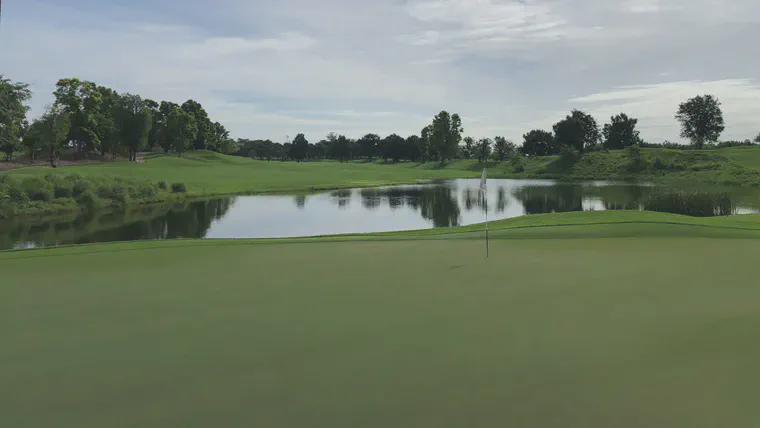
The measurements Brad and I took also show how with only a few drops, the Clegg can pick up subtle and real changes in conditions. One of the greens we measured was the 6th. This green is in the open, with plenty of light and air movement, and typically is the healthiest green on the property. Because of that, it also has the highest soil organic matter content. In recent OM246 tests, the 6th green had 9% more organic matter in the top 2 cm than the average of other greens tested.
We measured surface hardness and soil moisture on three greens—this one, the 6th, and also greens 2 and 12. Green 6 was the softest. It also had the highest water content.
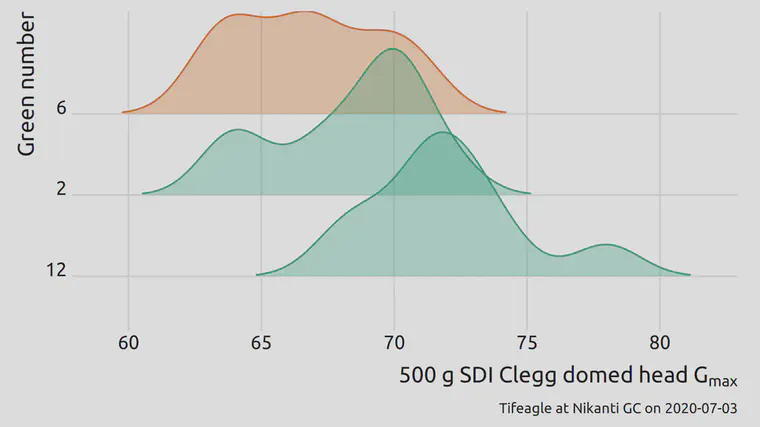
The average Clegg on green 6 was 5% softer than the average of the other greens. The Trufirm could not detect a difference, because of the additional variation in the Trufirm measurements.
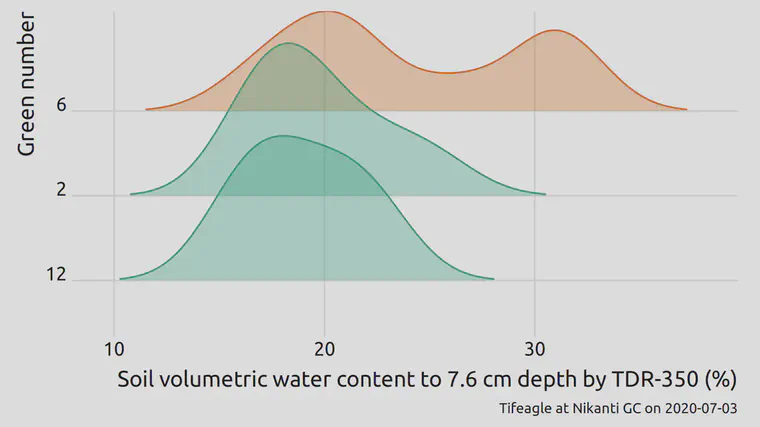
The average water content on green 6 was 25% higher than the average of the other greens.
The Clegg measurements match what is expected based on total organic matter at the surface.
The Clegg measurements match what is expected based on simultaneous measurement of soil moisture.
OM246 data are really useful
I’ve been suggesting to anyone who will listen that there is tremendous value in measuring total organic matter by depth—what I call OM246. Brad has been arranging this testing at Nikanti for 4 years now. Not only does this help to optimize the cultural practices related to disruptive practices like sand topdressing and scarification and coring, but it is related to playability as well (see previous section).
A tiny ClipVol bucket
Brad has been measuring clippings at Nikanti and has shared a lot of the data with me. We’ve also been working on a research project to be able to predict the dry weight of clippings from the clipping volume. While we’ve shared lots of data and photos, this was my first chance to get to Nikanti to see how the clippings are measured there. It’s a tiny little bucket they use.
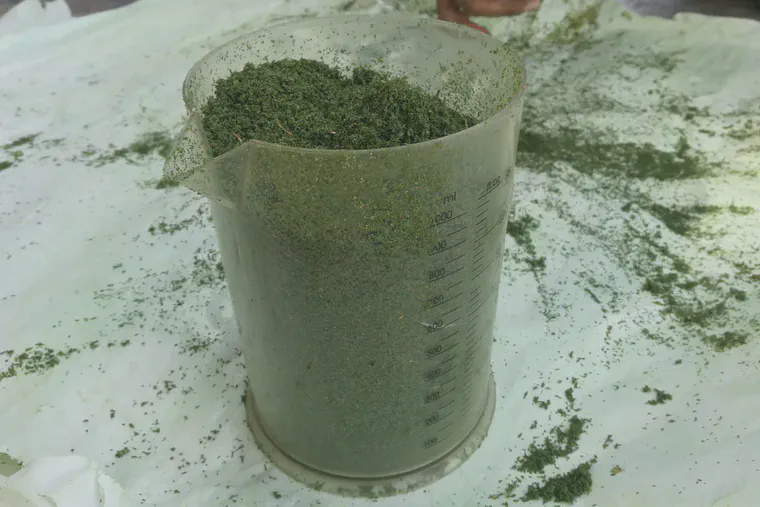
A 1 L bucket works when there aren’t that many clippings.
More than two birds
A lot more. I was impressed at all the birds I saw and heard in just a few hours at Nikanti. Two of my favorite birds to see in Thailand are the Asian openbill and the Asian golden weaver.
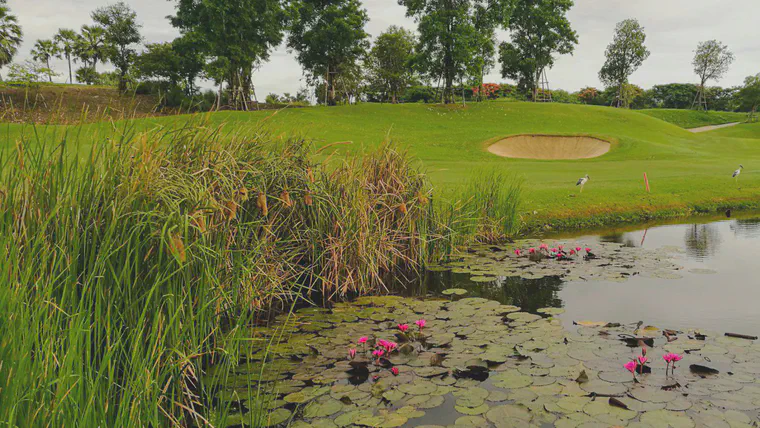
These reeds are full of golden weaver nests. And there are a couple openbills on the other side of the pond.
For more about turf management at Nikanti, see: