A tour of the Global DLI app
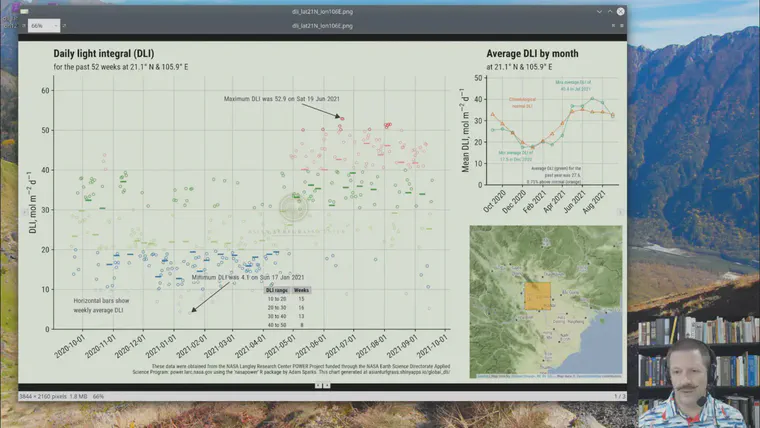
The NASA POWER agroclimatology dataset provides information on a global grid of 0.5° by 0.5°. The Global DLI app uses the nasapower R package to get global solar radiation data from NASA POWER. The app then converts those data to photosynthetically active radiation (PAR) units of daily light integral (DLI), and it produces a chart that summarizes the past year of DLI for the selected location.
In this video tour of the app, I show a few things that I often check when I am using it. These include:
- finding the app from the search page on the ATC website
- adjusting the map tiles to find exactly the location I am looking for
- not worrying much about what I see on the screen, and downloading the formatted chart
- often checking the table with the summed number of weeks in the past year within certain DLI ranges
- being aware that data can be downloaded directly from the NASA POWER data access viewer
For more reading about this topic, and to put these numbers into context, I recommend:
How much light is enough? Daily light integral requirements for warm-season grasses by Wherley et al.
What the tech? Measuring light for healthier turf by Richardson et al.
Light-tagged posts at asianturfgrass.com