A DLI Index
I’ve shown the sum of the mean daily temperature over 2014 for four locations: Fukuoka and Tokyo in Japan, Holly Springs in Mississippi, and Watkinsville in Georgia. Fukuoka had the highest accumulated temperature, then Tokyo, then Watkinsville, and the coolest of those four locations was Holly Springs.
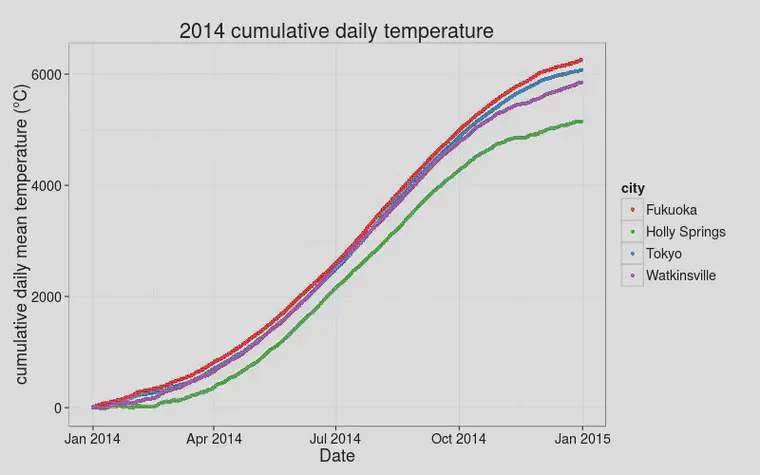
If one were wanting to rank these transition zone locations for suitability of ultradwarf bermudagrass, the temperature is an important factor. Looking at temperature alone, it would seem that in 2014, Holly Springs would have been the worst of those locations for bermudagrass, and Fukuoka would have been the best for bermudagrass.
But the light available for photosynthesis needs to be considered too. The photosynthetically active radiation (PAR) is reported as the daily light integral (DLI). For these same four cities, the cumulative DLI in 2014 has Watkinsville the highest, then Holly Springs, then Tokyo, and last is Fukuoka.
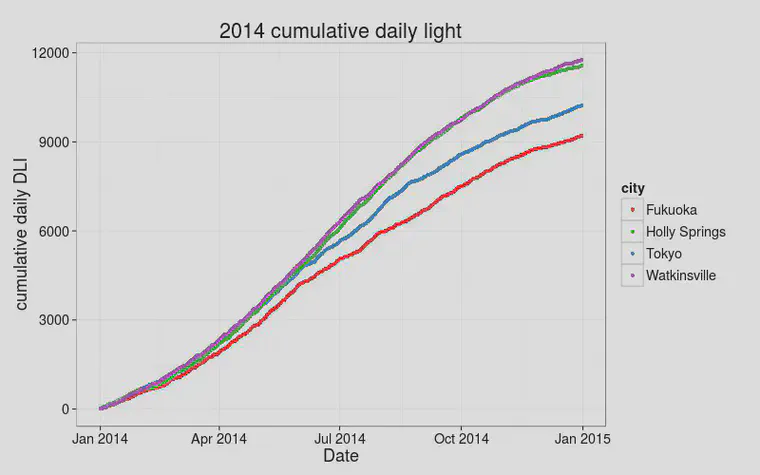
So now, if one were ranking the locations by light, it would seem that Watkinsville would have been the best location in 2014 for ultradwarf bermudagrass, and Fukuoka would have been the worst.
The daily mean temperature can be represented as a value between 0 and 1 – the temperature-based growth potential (GP).
Plotting the cumulative sum of the C4 GP, one gets the same ranking of the locations at the end of the year, but on a different scale. Note another difference between the cumulative temperature and the cumulative GP plots.
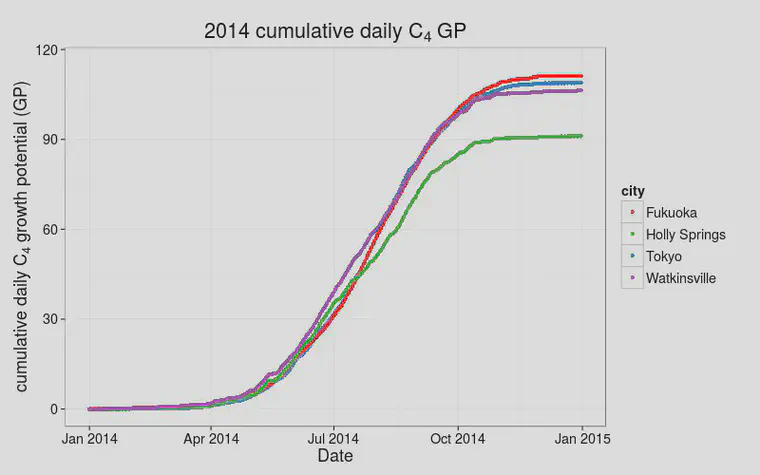
The slope of the GP plot is 0 (flat) when the temperatures are too cold for the grass to grow. This cumulative GP plot makes it easier to distinguish seasonal influence on growth than on the chart showing accumulated temperature.
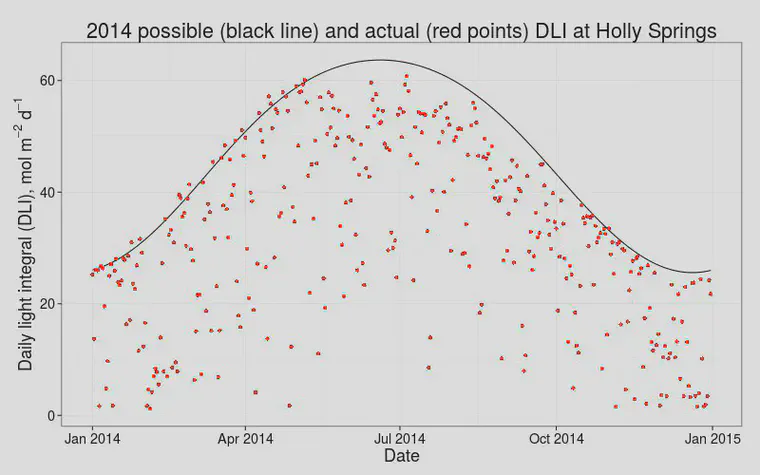
Can the DLI also be expressed as a value with a minimum of 0 and a maximum of 1, like the GP? Yes. One can express the actual DLI ($DLI_{actual}$) as a fraction of the maximum DLI ($DLI_{max}$) for that day and location. I’ll call that the DLI index, and it will be expressed on a scale of 0 to 1.
$$\text{DLI index} = \frac{DLI_{actual}}{DLI_{max}}$$
The $DLI_{max}$ varies based on latitude and day of the year. I’ve calculated a maximum DLI as 75% of the global solar radiation, as described here.
The actual DLI will be the same $DLI_{max}$ on a perfectly clear day with no clouds. When there are clouds or other particles in the air that block some of the light from reaching the surface, the DLI will be lower than $DLI_{max}$.
Rather than plotting the cumulative sum of DLI, one can plot the cumulative sum of the DLI index.
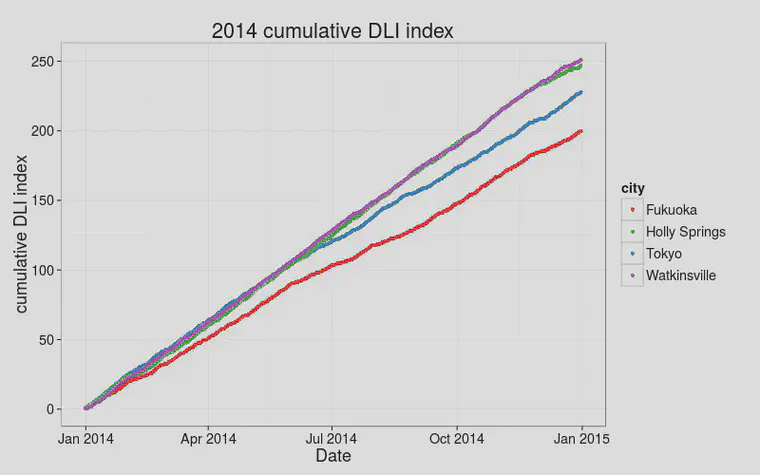
The cumulative DLI index plot gives the same separation at the end of the year as in the cumulative DLI plot, just on a different scale. Unlike the cumulative GP plot, the DLI index doesn’t have times of the year with a slope of 0.
If it gets cold enough, grass will go dormant. That’s what it means when the GP plot has a flat stretch. But DLI never gets that low. I’ve often been asked how to adjust the GP for light. And I usually respond that by explaining that temperature has more of an effect on turf growth than does light. So I usually prefer to just use the GP as an estimate of the potential for grass to grow.
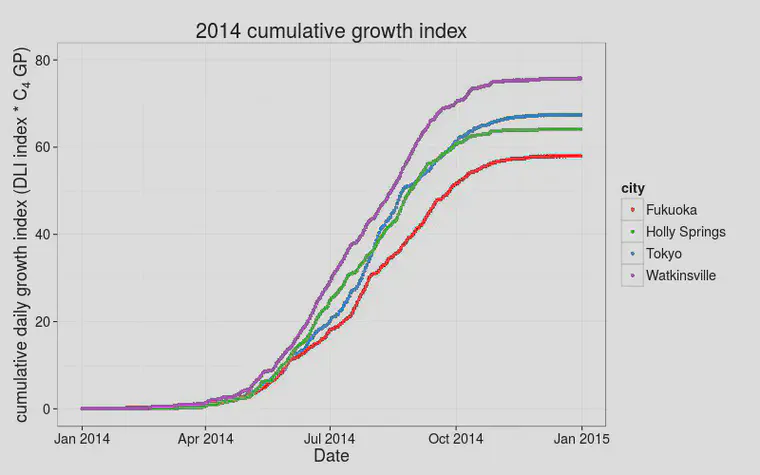
But if one wants to make an adjustment to GP for DLI, a reasonable way to do it is to multiply the GP by the DLI index.1 If we call the GP multiplied by the DLI index a growth index, it allows us to combine the light and temperature for a location to estimate their influence on growth.
Remember that by cumulative temperature, Fukuoka was highest, and Holly Springs was lowest. By cumulative DLI, Watkinsville was highest, and Fukuoka was lowest. By plotting the cumulative growth index, which combines temperature and light, Watkinsville is highest, then Tokyo, Holly Springs, and Fukuoka.
This plot is essentially taking the effect of temperature on growth and adjusting it for light, or conversely taking the light effect on growth and adjusting it for temperature.
One can easily compare relative differences between locations on a daily, weekly, monthly, or annual basis. With the ease of measuring DLI at different locations on a property using quantum meters, one can also use this growth index to demonstrate the effect of tree or structural shade.
For C3 grass, one may adjust the DLI index to account for the light saturation point. ↩︎