Fertilizer recommendations by three different methods: SPF, SLAN, and MLSN
Daniel Hahn and Romain Giraud wrote an article on LinkedIn about fertilisation decisions based on MLSN and STERF’s precision fertilisation (SPF). If you are at all interested in this topic, I hope you’ll read their article.
I read it twice, and I made a few notes to share here.
First, we (PACE Turf and ATC) calculated the MLSN based on Mehlich 3 soil test results. The article states that “it is essential to send a sample to a laboratory that uses Mehlich-3 nutrient extraction” if you want to use MLSN. I recommend that, but there are some workarounds if you can’t get Mehlich 3 data. Please have a look at the MLSN cheat sheet for some alternatives. My preferred alternative is to do what Giraud has done—calculated a regionally specific MLSN value based on his own database of soil test results from good-performing turf.
Second, they wrote that “for the MLSN guidelines, it is important to measure the soil nutrient levels at the beginning of the season and at the end of the season.” I don’t recommend that. I generally recommend sampling once per year, and I suggest autumn, or the end of rainy season in locations with pronounced wet and dry seasons, as the preferred sampling time.
Third, I like to put fertilizer recommendations into a larger context. What is really happening when one implements one method of fertilizer recommendation over another? To do that, I considered 1 000 simulated soils (locations), and calculated a P fertilizer recommendation for each of those locations across a range of N fertilizer inputs.
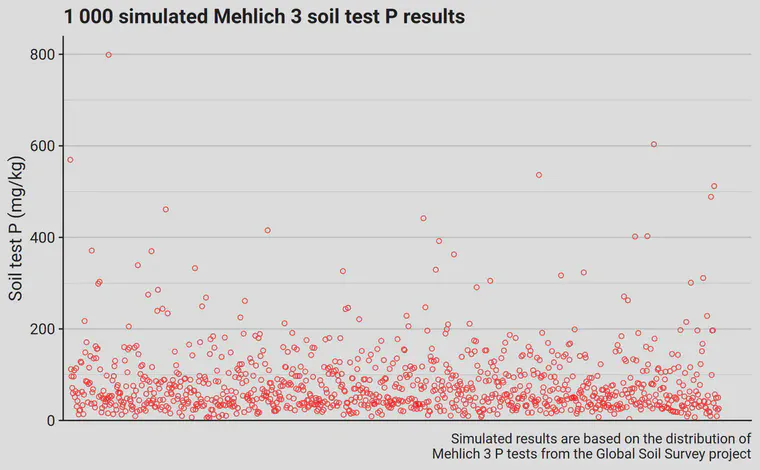
The 1 000 soils have soil test P as shown in this chart, ranging in this simulation run from 3.3 to 799 mg/kg. That’s a reasonable expectation based on the Global Soil Survey.
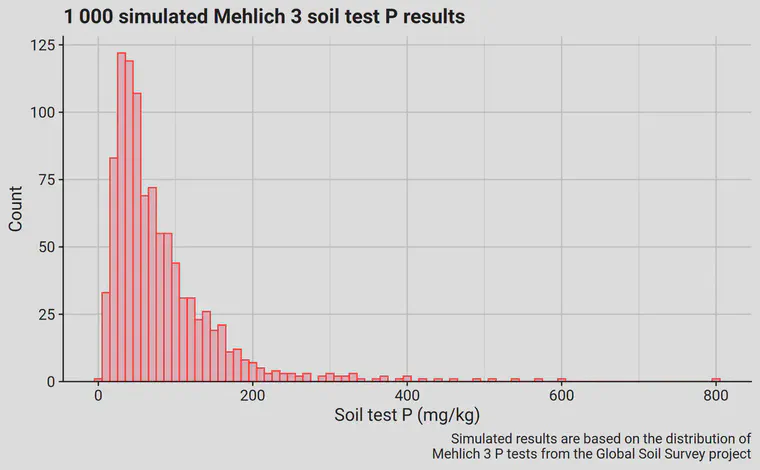
A histogram of those soil tests show that many are in the range 0–200 mg/kg.
From those results, I calculated the P fertilizer recommendation using MLSN, SPF, and SLAN.
- For MLSN, I took the expected plant use as 0.118 of the N rate1 and added the mass equivalent of 21 mg/kg, then subtracted the soil test value mass equivalent.
- For SPF, I ignored the soil test value and made the P recommendation as 0.14 of the N rate.
- For SLAN, I ignored the expected plant use from N rate and calculated the P recommendation as the mass of P needed to increase the soil test P to 55 mg/kg.
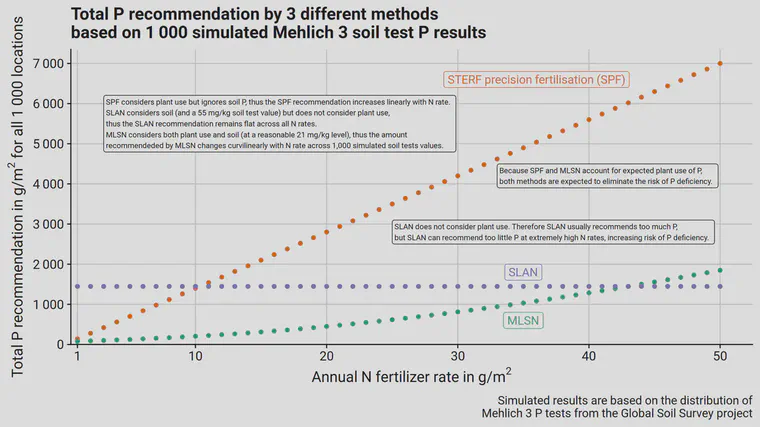
The chart above shows those results summarized for all 1 000 of the simulated soils, at each of the N rates from 1 to 50 g/m2. What the chart shows, exactly, is the total P recommended, in g/m2, for each N rate, summed over all 1 000 of the soil test results. For example, look at the annual fertilizer rate of 20 g N/m2. For the SPF method, the P recommendation will be 0.14 the N rate. Each of the 1 000 soils at the 20 g N rate would get a P recommendation of 2.8 g. With 1 000 soils, that’s a total amount of 2 800 g of P recommended, which you can see on the chart above. That works out to 2.8 g P/m2 for each soil, or 28 kg/ha.
Looking at that chart for P recommendations, we can see pretty much the entire range of N rates—I know a few places go higher, but it’s uncommon—and a realistic sample of actual soil P levels.
From this type of calculation, it’s apparent that using SLAN will over-recommend P except at very high N rates. It’s also apparent that SPF recommends reasonable rates of P at low N rates but that ignoring the soil leads to quite high P application rates by SPF at higher N rates.
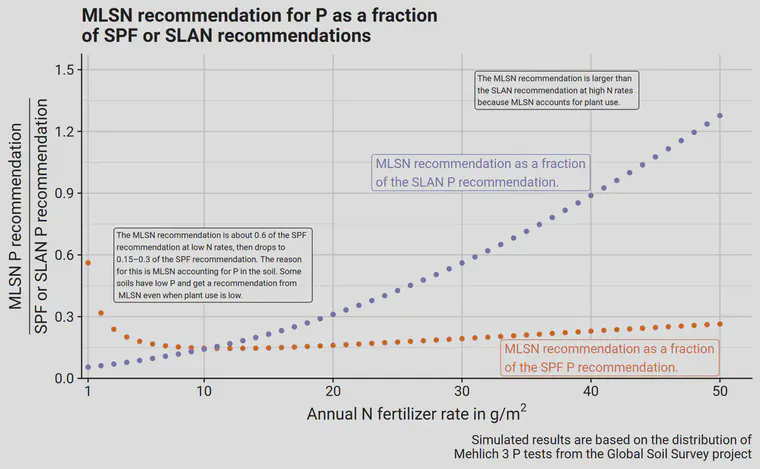
I show in the final chart the actual recommended P ratios of MLSN compared to SPF and MLSN compared to SLAN.
It’s possible to work through this type of calculation for any element, and from such an analysis to get some idea of what the implications are of using alternative methods of soil test interpretation and fertilizer recommendations.
This 0.118 is based on ATC research on creeping bentgrass on golf course putting greens. ↩︎