The turfgrass genki level, part 2: showing N applied in relation to standard N
I showed in part 1 how one can go from temperature to a temperature-based growth potential to a standard N amount.
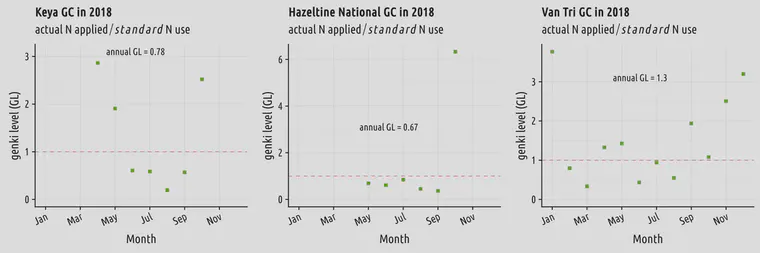
By looking at the actual N applied, and comparing that amount to the standard N for any location, one gets what I call the genki level.
If less N is applied than the standard amount, the GL will be less than 1. If more N is applied than the standard amount, the GL will be more than 1. The GL provides an indication of:
- how much the grass is being pushed to grow
- how much one is withholding N at a time when the grass has a high potential to use N
- how that pushing and withholding varies through the year, or from site to site
Let’s look in a little more detail at the GL development at Van Tri GC in Hanoi.
Van Tri is wall-to-wall seashore paspalum. One can start with the temperatures, then work through to the GL as shown in this chart. During the winter months, more N is applied to maintain colour and to try to minimize dollar spot damage.
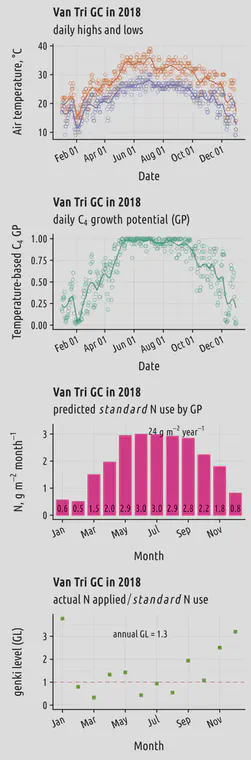
What about during the summer months? Why is there sometimes a high GL then too, and an annual GL of 1.3? Much of this comes down to management style and grass conditions at the time. And I think there is a relation to grass species too, in this case. Seashore paspalum gets overrun in this climate by Cynodon and sometimes even Zoysia. In order to minimize problems with those invading species, and to minimize problems with weeds in general, seashore paspalum is often maintained at a relatively rapid growth rate.