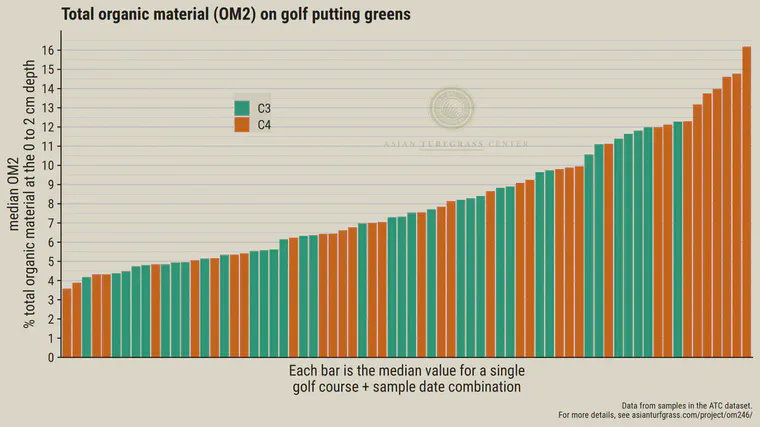
What's normal for OM2
These are median values for the total organic material right at the surface of golf course putting greens.
I’ve been trying to explain what’s normal, and in one of those explanations I ended up making these charts.
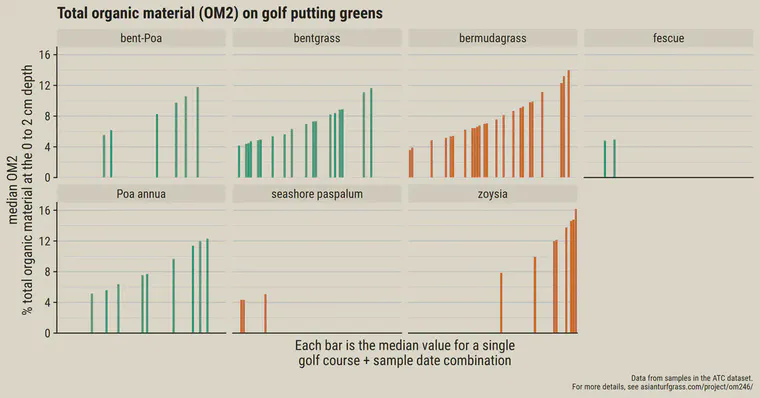
I also separate those same data by species.
In ATC’s report for OM246 tests (see a sample report with charts), I include charts and percentiles that show what is normal for the current test results, based on the most recently updated version of the dataset.
If you want a take-home message from seeing that OM2 can vary from one course having less than 4% and courses filling up the range in between all the way up to more than 16%, I will reiterate that I find this most useful as a way to assess the effect of the maintenance work by checking the change in total organic material over time. I explained this in one simple trick to transform putting greens from usually good to consistently great. That is, I can have great greens at OM2 of 5%, 8%, and 12%. That’s something that depends on the specific course. But within a specific course, looking at change over time is remarkably informative about the effects of the maintenance practices and the growing conditions between sampling events.