Three #rturf projects: green speed & clipvol, zoysia response to fertilizer during grow-in, and report automation
You may have seen a few posts about #rturf on my personal site. I’m writing about that topic over there so I don’t clutter up the ATC site with too much data analysis and computer code. However, a few readers may be interested in that series, so I’ll introduce it here as well. And then continue it at micahwoods.com.
R, from the project website’s description, “is a free software environment for statistical computing and graphics.” This is software that I’ve been using for almost a decade. I have some level of proficiency with some aspects of this software, enough to where I can sometimes write scripts that work correctly the first time I run them, without me having to search the documentation or help pages to find how to do what I want.
There are plenty of excellent resources for learning R, or the particular things that one might want to use this software for, and this series isn’t about that. And I’m not a statistician, so this isn’t a tutorial on statistics either. This is a series about some of the things that I’ve learned over the years, and that have worked well for me, as I have gone from complete beginner who couldn’t read in a file of data to get started, to my current level of being able to work with the software to make charts and do some analyses and create some reports.
Who might find this series useful?
turfgrass graduate students (and turfgrass scientists) who would like to learn about my experience with R and perhaps pick up a few new ideas
turfgrass managers who are fascinated by data analysis and graphical presentation of data, and who might even like to dabble with this software for some of their own projects
anyone in the turfgrass industry who wants to see a little bit of behind the scenes data analysis
Here’s an introduction to the first three projects I’ll be working on. These are things I was going to do anyway. After a suggestion a few months ago that I might share some of my experiences with R, it seemed natural to work on these, which I expect might be of general interest.
The relationship between clipping volume and green speed
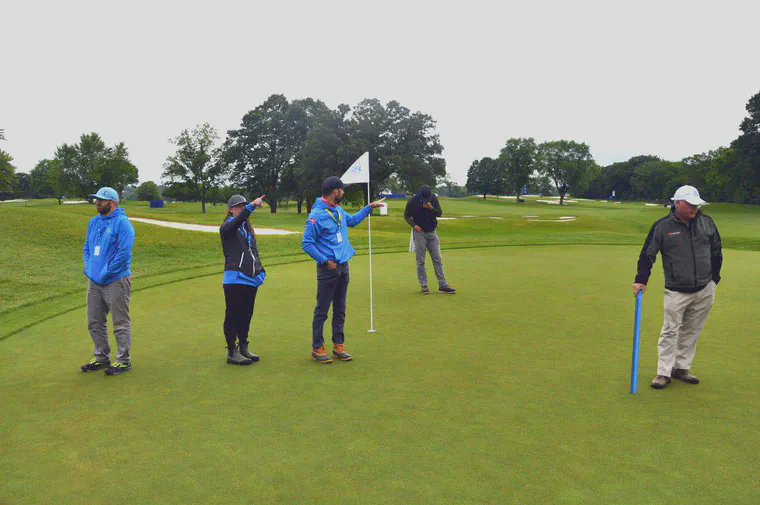
My interest in clipping volume started when I noticed a negative correlation between clipping volume and green speed. That is, when clipping volume went down—when the grass was growing less—the green speed measured with a stimpmeter was faster.
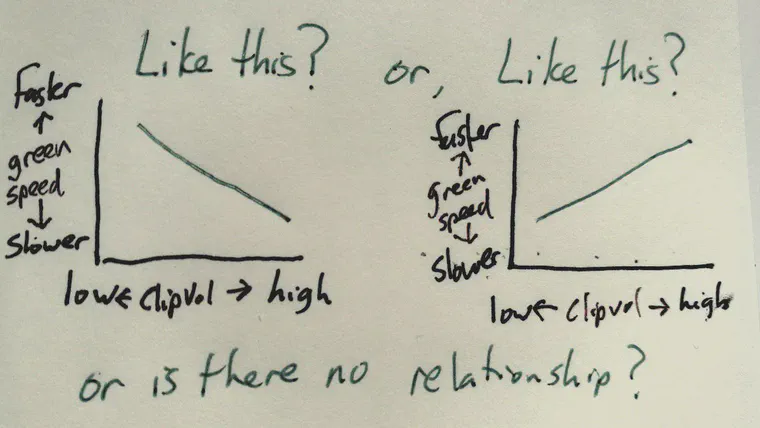
It’s not clear what the magnitude of this effect is, or how consistent it is, or if it is meaningful, and Bill Kreuser has pointed out a few times that there are situations where one finds no effect.
I’ve been thinking about this for a while, and I made some notes about it in 2019.
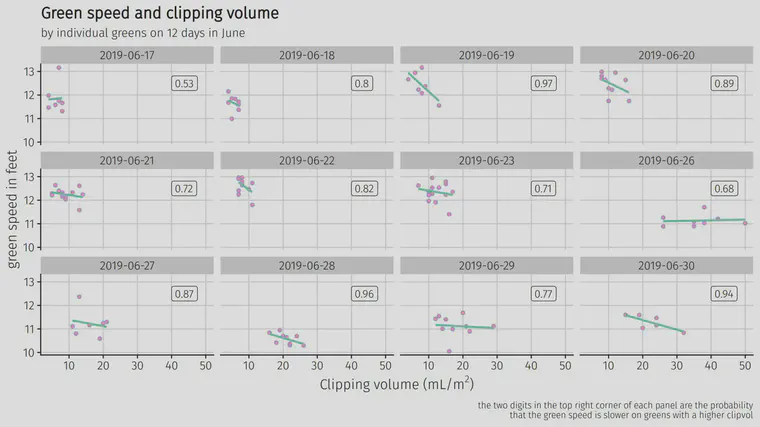
I also made a simple model last year, looking at the slopes of lines that varied by date during the second half of June 2019, with the slope of the line showing whether the green speed was going up or going down on greens that had the same treatments of mowing and rolling but varied in clipping volume.
I hadn’t looked at this project for 13 months, and I’ve gotten started with it again in the first rturf posts. I’ve looked at:
why we might want to use this type of software
how to load a file into the R working environment
some common functions used to summarize and understand data
how to create a project
how I typically structure a project
how to use the help/documentation built-in to R & RStudio
how to create a new variable by making a calculation
Coming up is an infinite amount of things that might be looked at, but certainly there will be:
how and why to write your own functions
a very gentle intro to Git and version control and putting a project onto GitHub
making more detailed charts
merging two files to combine the green speeds and the clipping volume
calculating some statistics
Zoysia sprig response to fertilizer at grow-in
I’ve shown that zoysia responds to fertilizer at establishment when the nutrient demand is high.
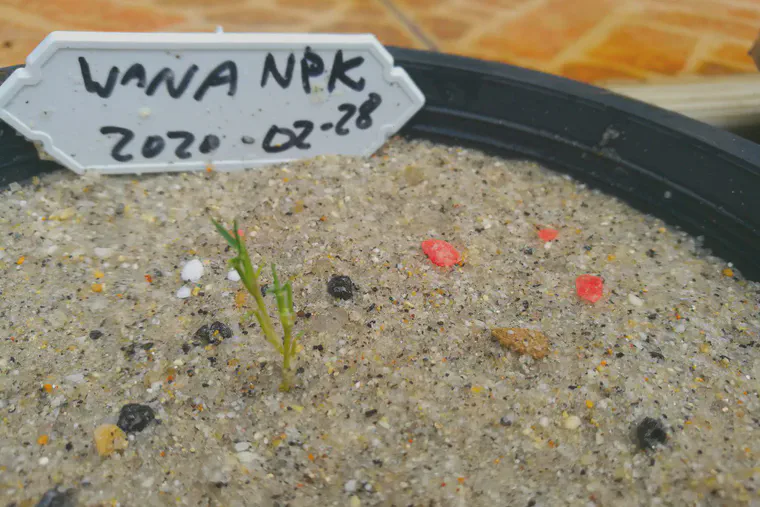
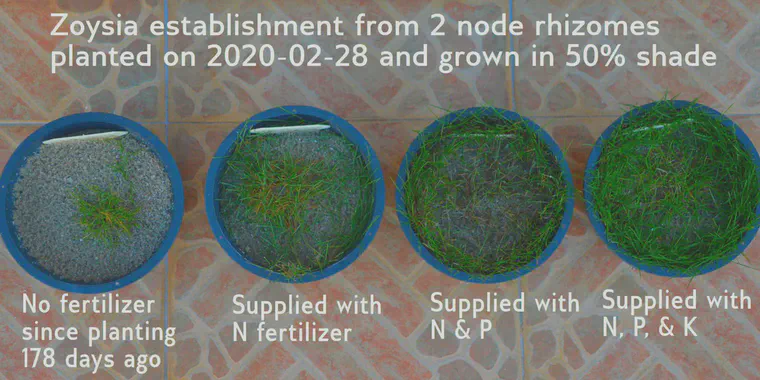
I’ve continued that project with manilagrass (Zoysia matrella) planted as two node rhizomes at the end of February in a river sand. After a week, the pot receiving N, P, and K looked like this. Each pot started as basically nothing—just two nodes on a rhizome.
After 178 days, this is what the pots look like. The one that hasn’t received any fertilizer isn’t dead, but it hasn’t established nearly as much as the pot that got N, and that one didn’t establish as well as the ones that got N and P, or N, P, and K.
It seems obvious that nutrient demand, and consequently grass response to supplied (or to withheld) nutrients, will be related to the grasses’ potential to grow in that particular growing environment. Mike Richardson has shown that zoysia doesn’t have much response to nutrient additions at planting in Arkansas.
In this project, I intend to demonstrate use of some R packages that can obtain historical weather data, and from that to estimate growth potential and nutrient demand at various places. I have a hunch that the response or non-response, or the degree of response, to fertilizer addition is very likely related to the temperature at a particular location. We might look at Bingley in Yorkshire, State College in Pennsylvania, Fayetteville in Arkansas, maybe Knoxville in Tennessee, and a few locations in Asia.
Report production and automation
R has a number of features and packages that can produce reports of any type you can imagine. This is often useful when one is wanting to produce the same type of report, repeatedly over time, but when the data to go into the report will change. Think perhaps of soil test reports (I produce mine with R code) or perhaps weekly summaries of course conditions, or daily reports of hole locations. I’ve got a few new automated report templates I’d like to work on, and I will demonstrate how I would go about doing that in the third project of this rturf series.
And after that, who knows. Maybe that will be everything, or if there is continued interest and if I am having fun with it, it could continue.