Looking at times and words from ten thousand tweets
A few years ago I saw Julia Silge’s post on Ten Thousand Tweets. I thought that was an interesting analysis, and I made a note to do a similar analysis once I had sent 10,000 tweets. That happened recently, and when it did I downloaded my Twitter archive.
After extracting the archive the tweets are conveniently in a .csv file, and I put that in the data folder and then used the code here to make these charts.
In 2009 and 2010 I often said I wouldn’t join Twitter. I didn’t see any reason to write or read short bits of text. I didn’t want to tell anyone what I was doing all the time, and I didn’t particularly care to know details of others’ daily routines either. But I was writing about turf at www.blog.asianturfgrass.com and at www.asianturfgrass.com, and of course I wanted (and still want) more people to read what I write.
On the last day of December in 2010 I was checking the stats for my blog, and I noticed that there were an unusually large number of pageviews for this post about plant available nutrients. “Why is that?” I wondered, and I checked the source of the visits. They were coming from a link posted on Twitter by Dave Wilber. The next day I created the asianturfgrass account.
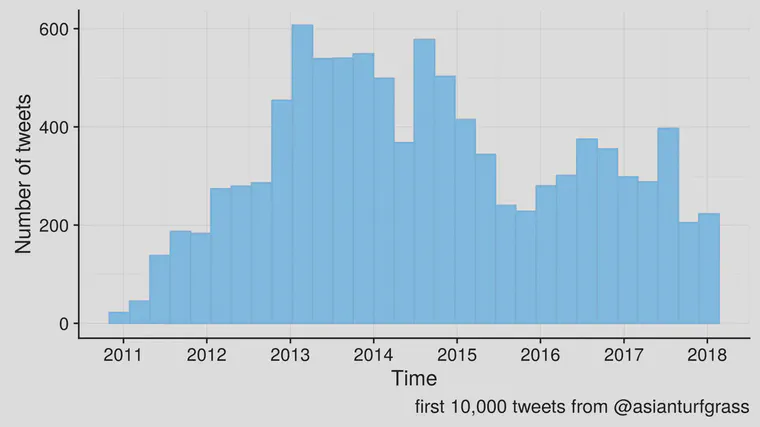
Since then, how have I tweeted? This is a histogram of the first 10,000 tweets by the date and time sent. I travel to a lot of time zones, and in these charts all the dates and times are set in the Bangkok time zone (UTC +7).
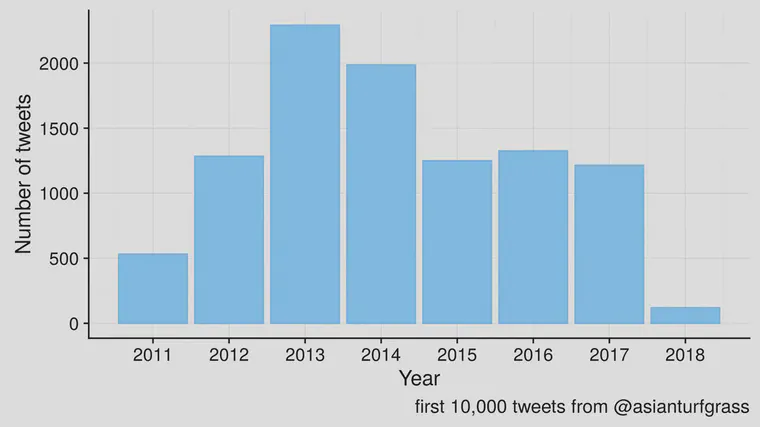
I can summarize the tweets by year. The year with the most was 2013, and then 2014. Since then, the tweets per year has been stable at around 1,250. There is only so much I can say without feeling that it is excessive, or repetitive. I’ve written a lot of things on my blog, so if people have questions, I try to direct them there rather than repeating myself on Twitter.
That reminds me of David Robinson’s saying, paraphrased here:
“When you’ve given the same advice three times, write a blog post. When you’ve written the same blog post three times, write a book.”
When there is the same topic again and again, I prefer to write on my website or my books.
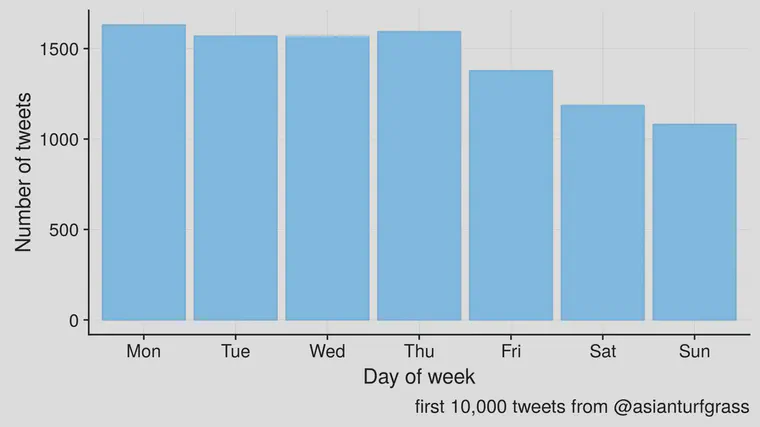
By day of the week it is pretty standard – I’ve sent fewer tweets on the weekends.
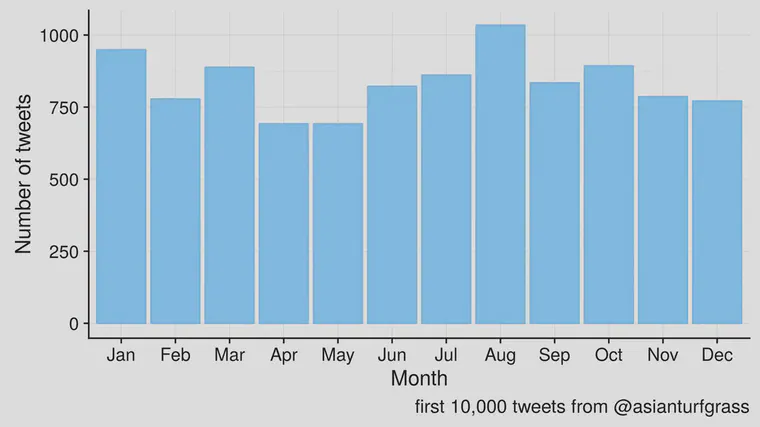
There is also some variation by month. August has the most. That’s because for the past five years I have been sending a lot of tweets about the fascinating KBCオーガスタ golf tournament.
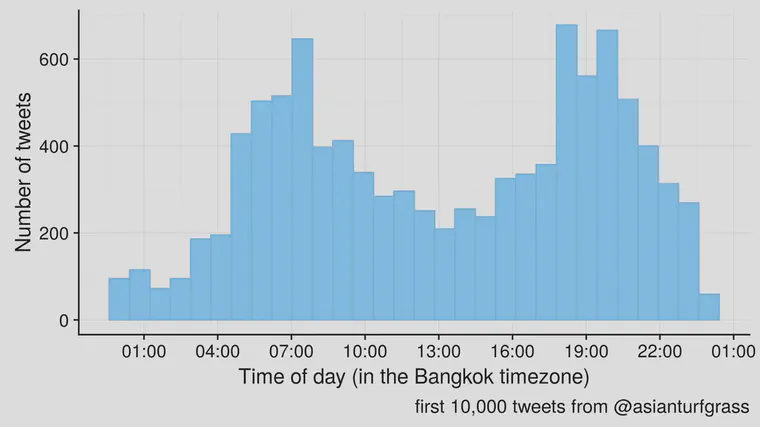
I can also look at the 10,000 tweets by time of day. These are all in the UTC +7 time zone. I spend about 75% of the year, on average, in some part of Asia, so I’ll be pretty close to that time zone most of the time, and this chart shows that I am sending the most tweets in the morning and the evening in that time zone.
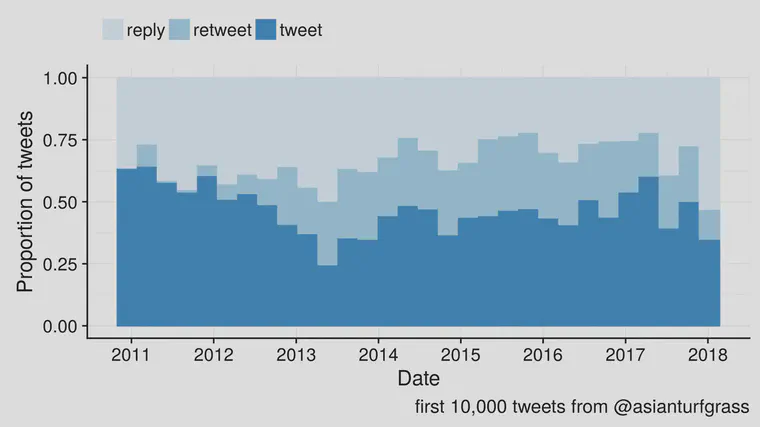
How about new tweets vs. retweets vs. replies, and has that changed over time? For the past few years I’ve been sending fewer new tweets, down to about 40% to 50% now, and retweets are about 25%, and replies about 25% to 35%. That changes of course depending on the conversations.
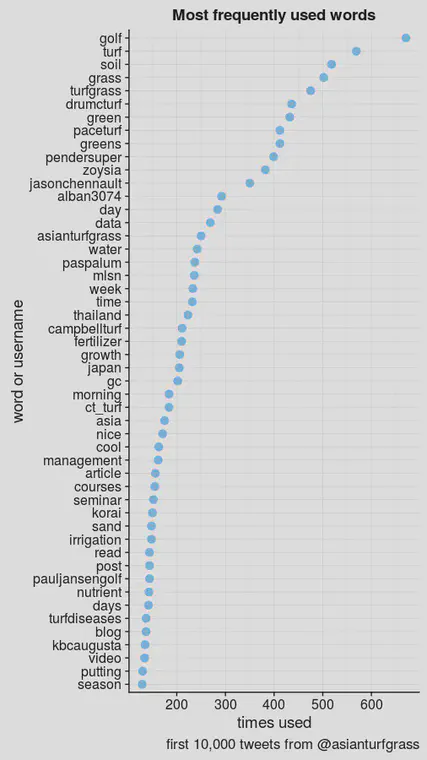
I wondered what the most common words in my first 10,000 tweets were, so I counted them. These are the top 50, and they include words and some usernames of people I’ve frequently corresponded with.
If you’d like to see the code I used for these calculations and charts, it’s here.