A global DLI app
This app produces a summary chart of photosynthetically active radiation (PAR) expressed as the daily light integral (DLI) for anywhere in the world
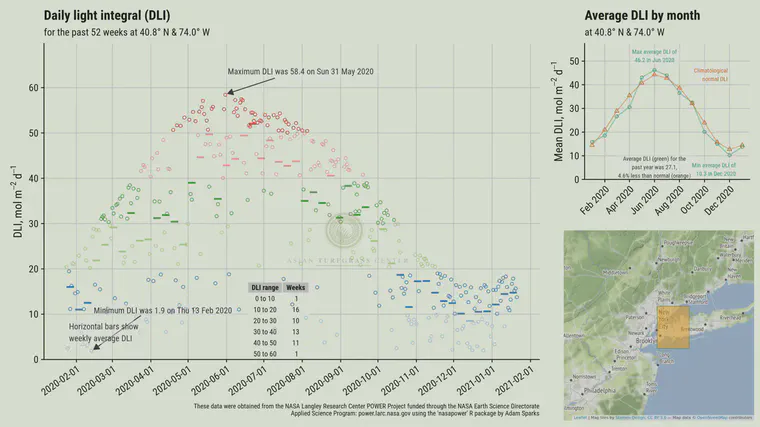
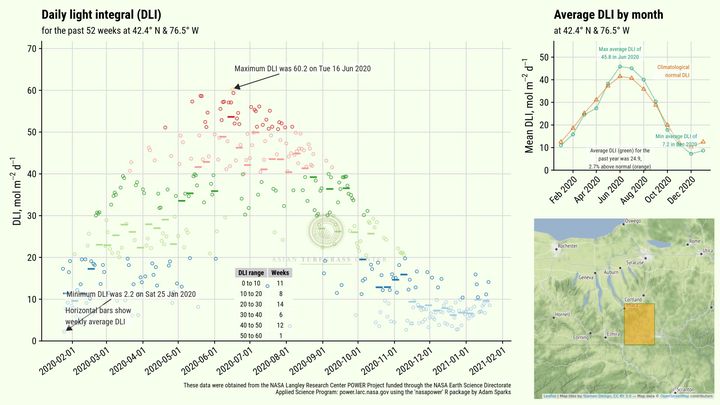 Downloadable app summary chart for Ithaca, New York
I made a Global DLI app to generate summary charts of DLI for anywhere in the world.
This app uses the nasapower R package to get satellite data from the NASA POWER Agroclimatology dataset.
Some results are shown within the app, but they are not formatted for perfect display on a phone or computer. I did attempt to add some formatting for the downloadable summary charts which you get to at the end of the app.
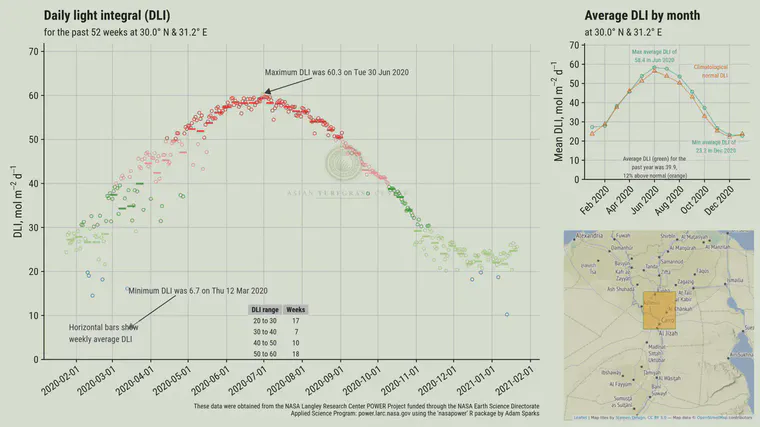
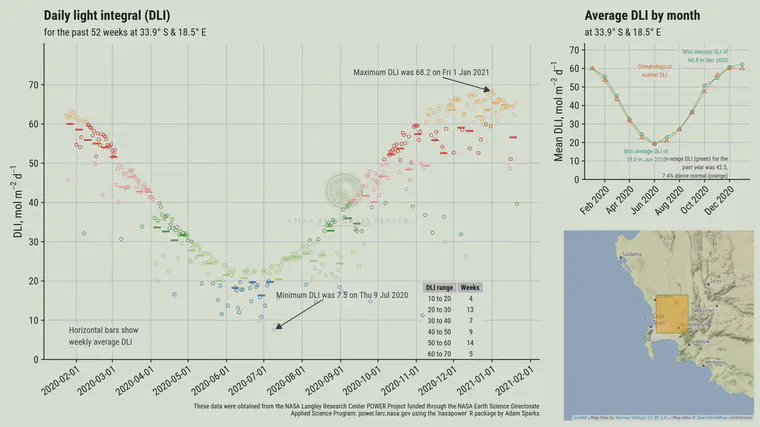
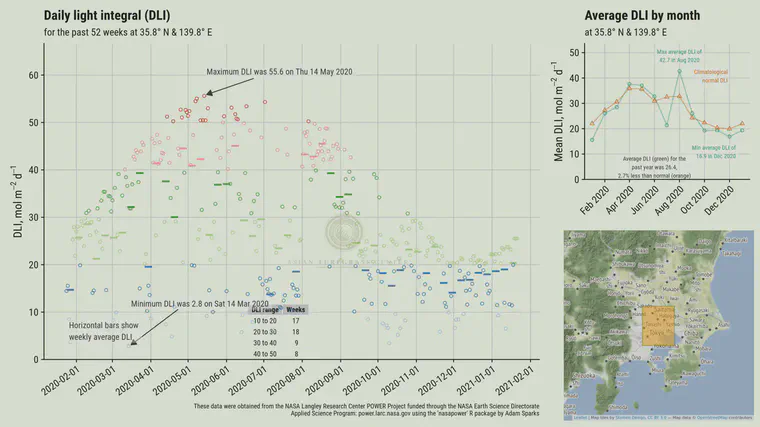
That was my objective, to make a downloadable summary chart (like these representative ones shown below for Cairo, Cape Town, New York City, and Tokyo). I hope you’ll find this useful. And I hope there aren’t too many bugs!