Green speed change from morning to afternoon
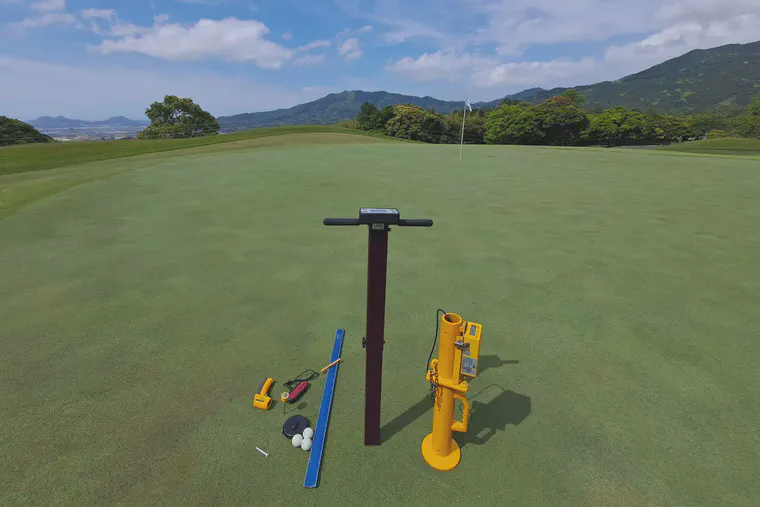
I brought my measuring tools to Fukuoka Raizan Golf Club last week. I measured green speed before and after tournament play with the stimpmeter, among other measurements. Here are some of the observations I made during the JLPGA’s Sky RKB Ladies Classic tournament.
Rolling greens
I made this short video showing the Hatsuta roller in action. The video also has a clip of a remote-controlled mower that is used for steep slopes.
Greens were rolled in the afternoons. Greens were not rolled in the mornings.
Green speed morning and afternoon
I was at the course from Tuesday through Sunday. I collected data on six days, measuring green speed with the stimpmeter after the morning work had been completed but before the first group, and again after the final group had finished but prior to any afternoon work.
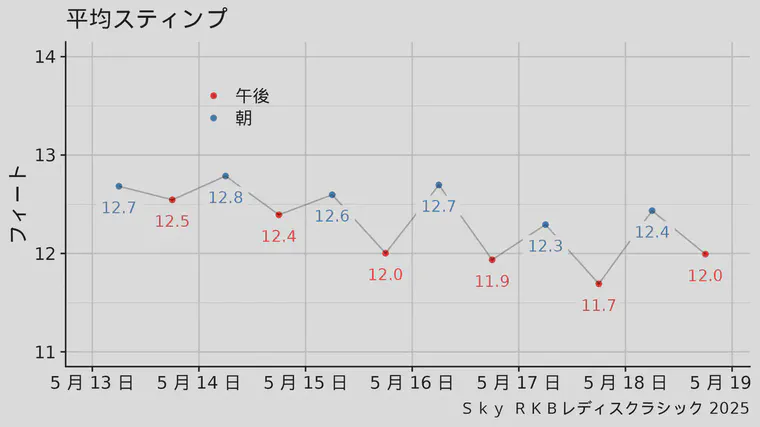
The chart above shows the average green speed in decimal feet. The blue values are morning measurements and the red values are afternoon measurements.
I noted the time I made each measurement. The average decrease in green speed was 0.6 inches per hour. That would work out to 4.8 inches in 8 hours. This is an elite decrease—measurements I’ve made at other events have generally had a decrease closer to 1 inch per hour.
Surface hardness and soil water content
In addition to green speed, I also measured surface hardness with my Golf Course Firmness Tester (500 g Clegg from SDi). There was no rain or irrigation at the start of the week, and the greens dried down to 16.2% volumetric water content (VWC) by Friday afternoon. At that time, the average surface hardness was 113 (Gmax).
On Friday night and into Saturday morning, more than 30 mm of rain fell at the golf course. That brought the rootzone to field capacity. On Saturday morning I measured an average VWC of 27.7%.
The surface hardness went from 113 under relatively dry conditions to 100 on Saturday morning at field capacity. That’s a drop of 11.5%.
I should note that at the last OM246 test on these greens, the OM2 was 5.3%, which is slightly below average for bentgrass greens. The OM4 and OM6 were both above average for bentgrass greens. The Cu of the OM2 layer (the 0–2 cm layer) was 1.96, which is at the lower end of the USGA’s recommended range of 1.8 to 3.5.
Photo gallery
I put some photos from the week on Instagram in this gallery.
More about surface hardness and water content
If you are interested in this topic, have a look at this old blog post: Relationship between soil water content and turfgrass surface hardness.
I’ve been working on this project since 2011, collecting thousands of paired measurements between VWC and surface hardness under both regular and tournament conditions.
That blog post above includes this chart from 2012.
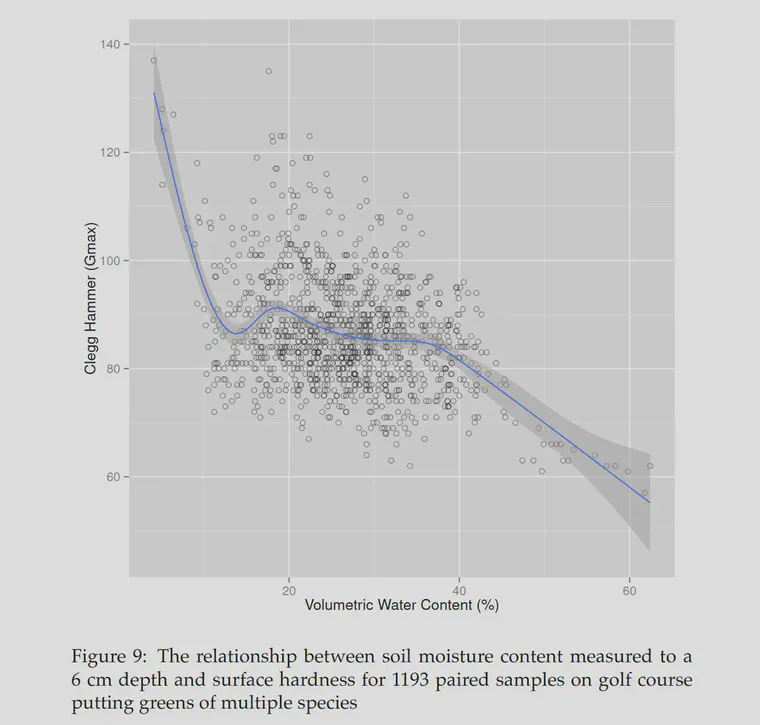
I’ve had many years to think about this, and I have collected a lot more data. A number of things seem clear to me now.
- the measurements have a lot of error, but if we take enough of them, we can identify the relationship between surface hardness and soil water content
- higher VWC leads to softer surfaces
- there is no universal relationship between specific VWC values and specific firmness values
- there are consistent relationships for a certain soil state between specific VWC values and specific firmness values
I was checking this on the greens at Raizan GC, and for the greens in their current state, the surface hardness goes down by about 0.9% for every 1% increase in soil water content. This specific relationship will vary depending on the state of the green. By state, I mean the current combination of grass species, season, time since most recent cultivation event, and so on.